Guide
Inspecting a request and response
Check headers, bodies, status and timing for any call your app makes.
Every captured call can be opened to see exactly what was sent and received. Use this to confirm a screen's data problem starts, or doesn't, in the network layer.
Step 01
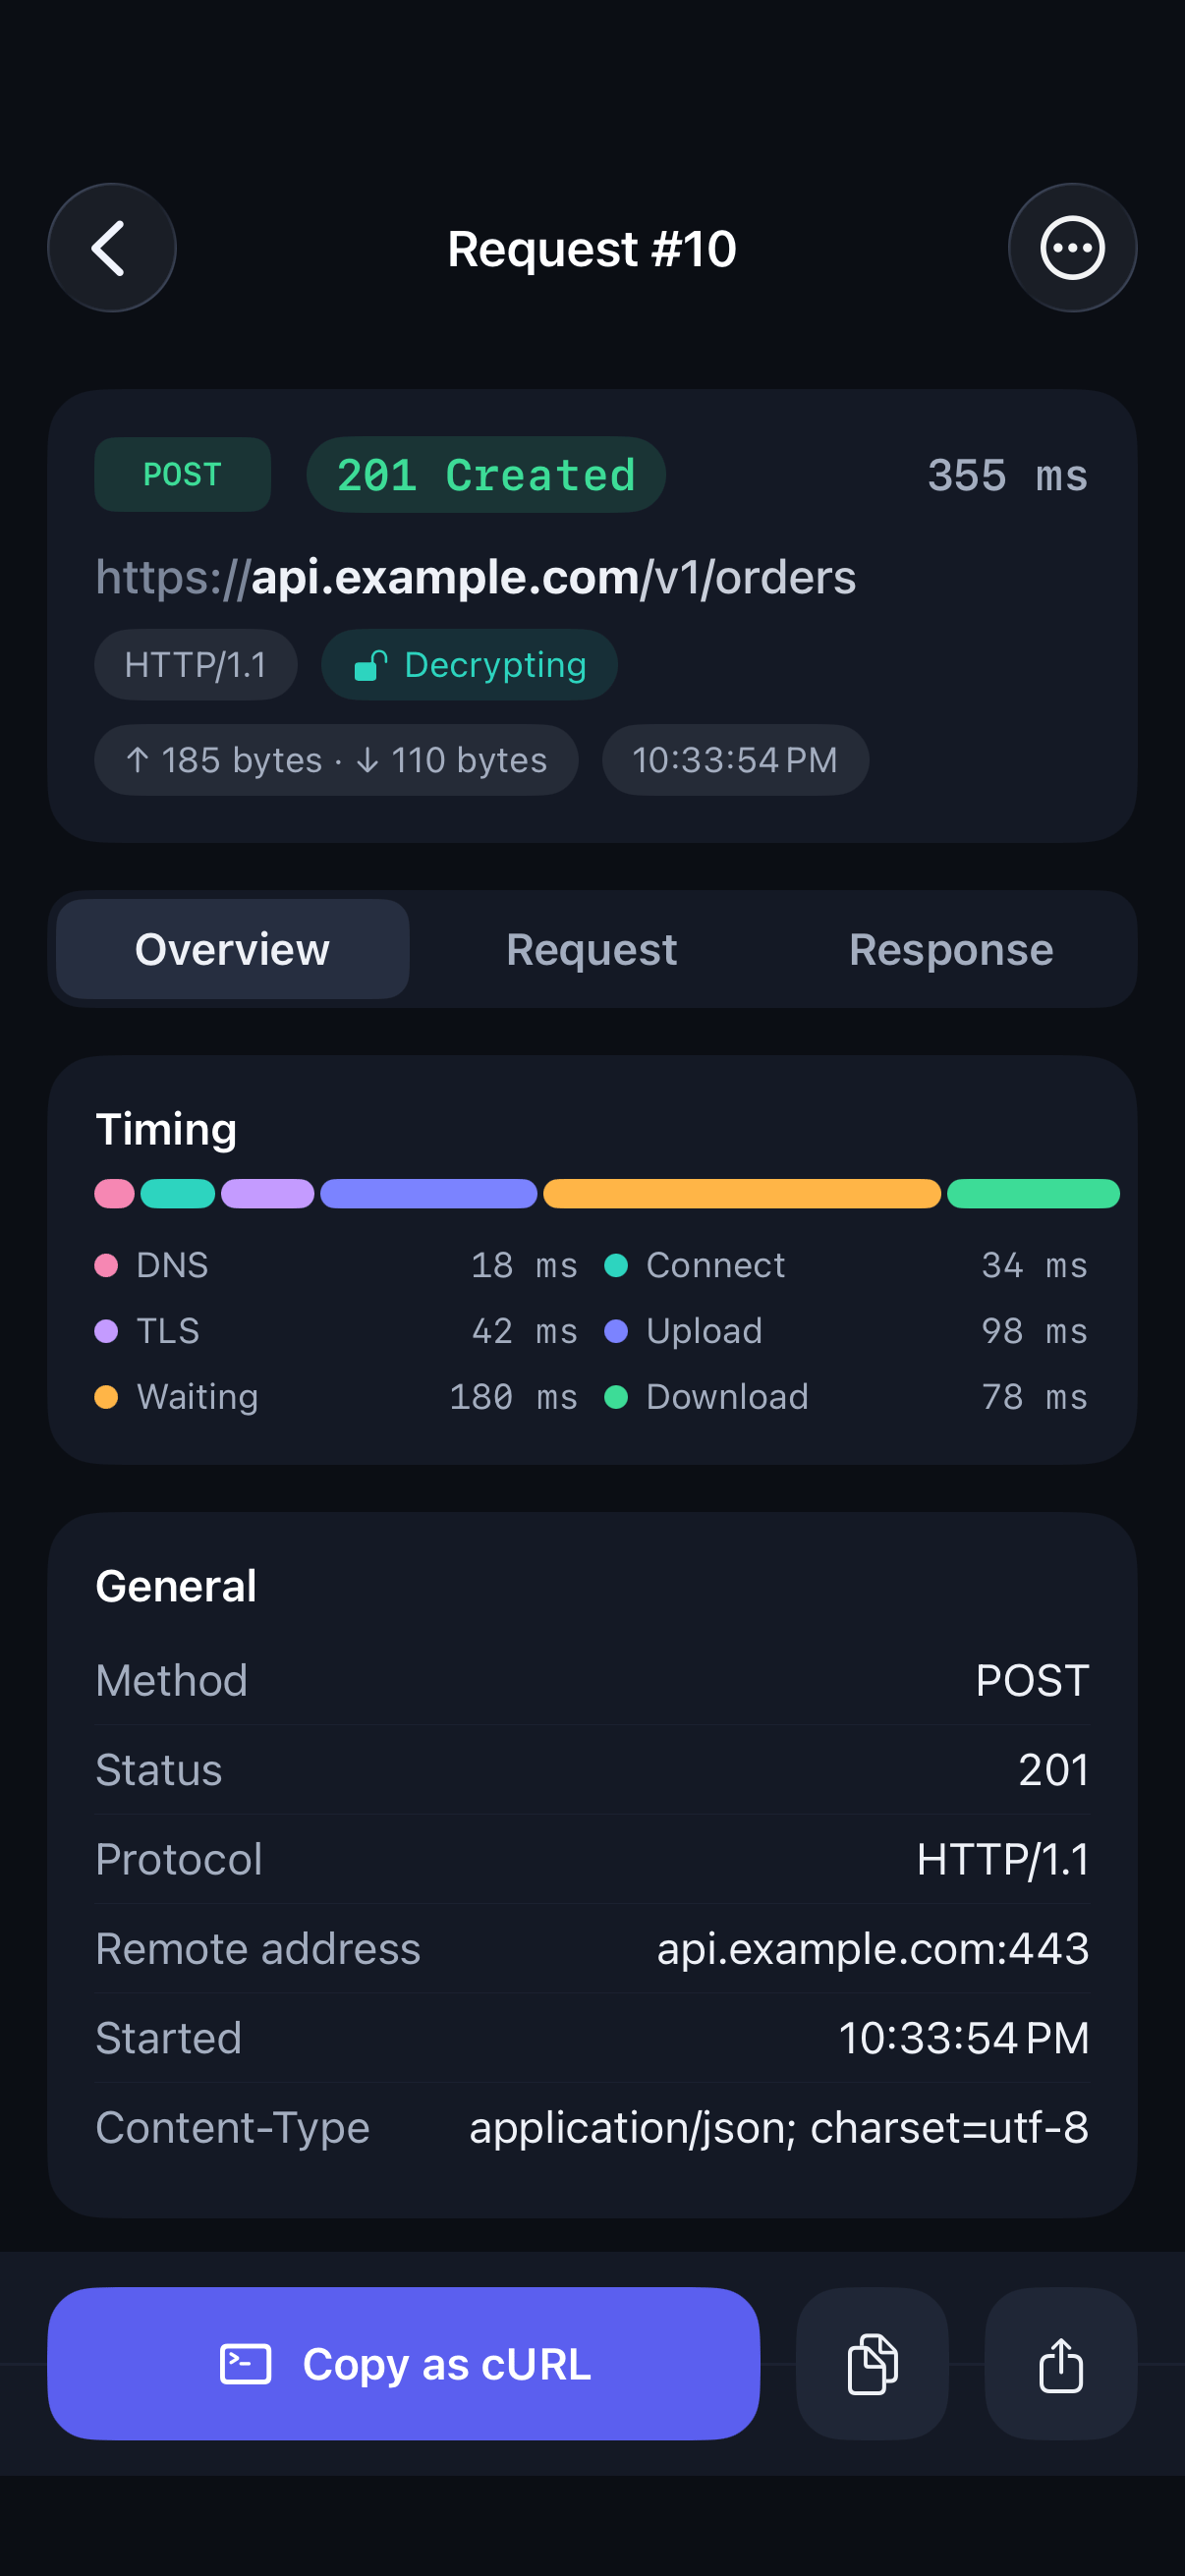
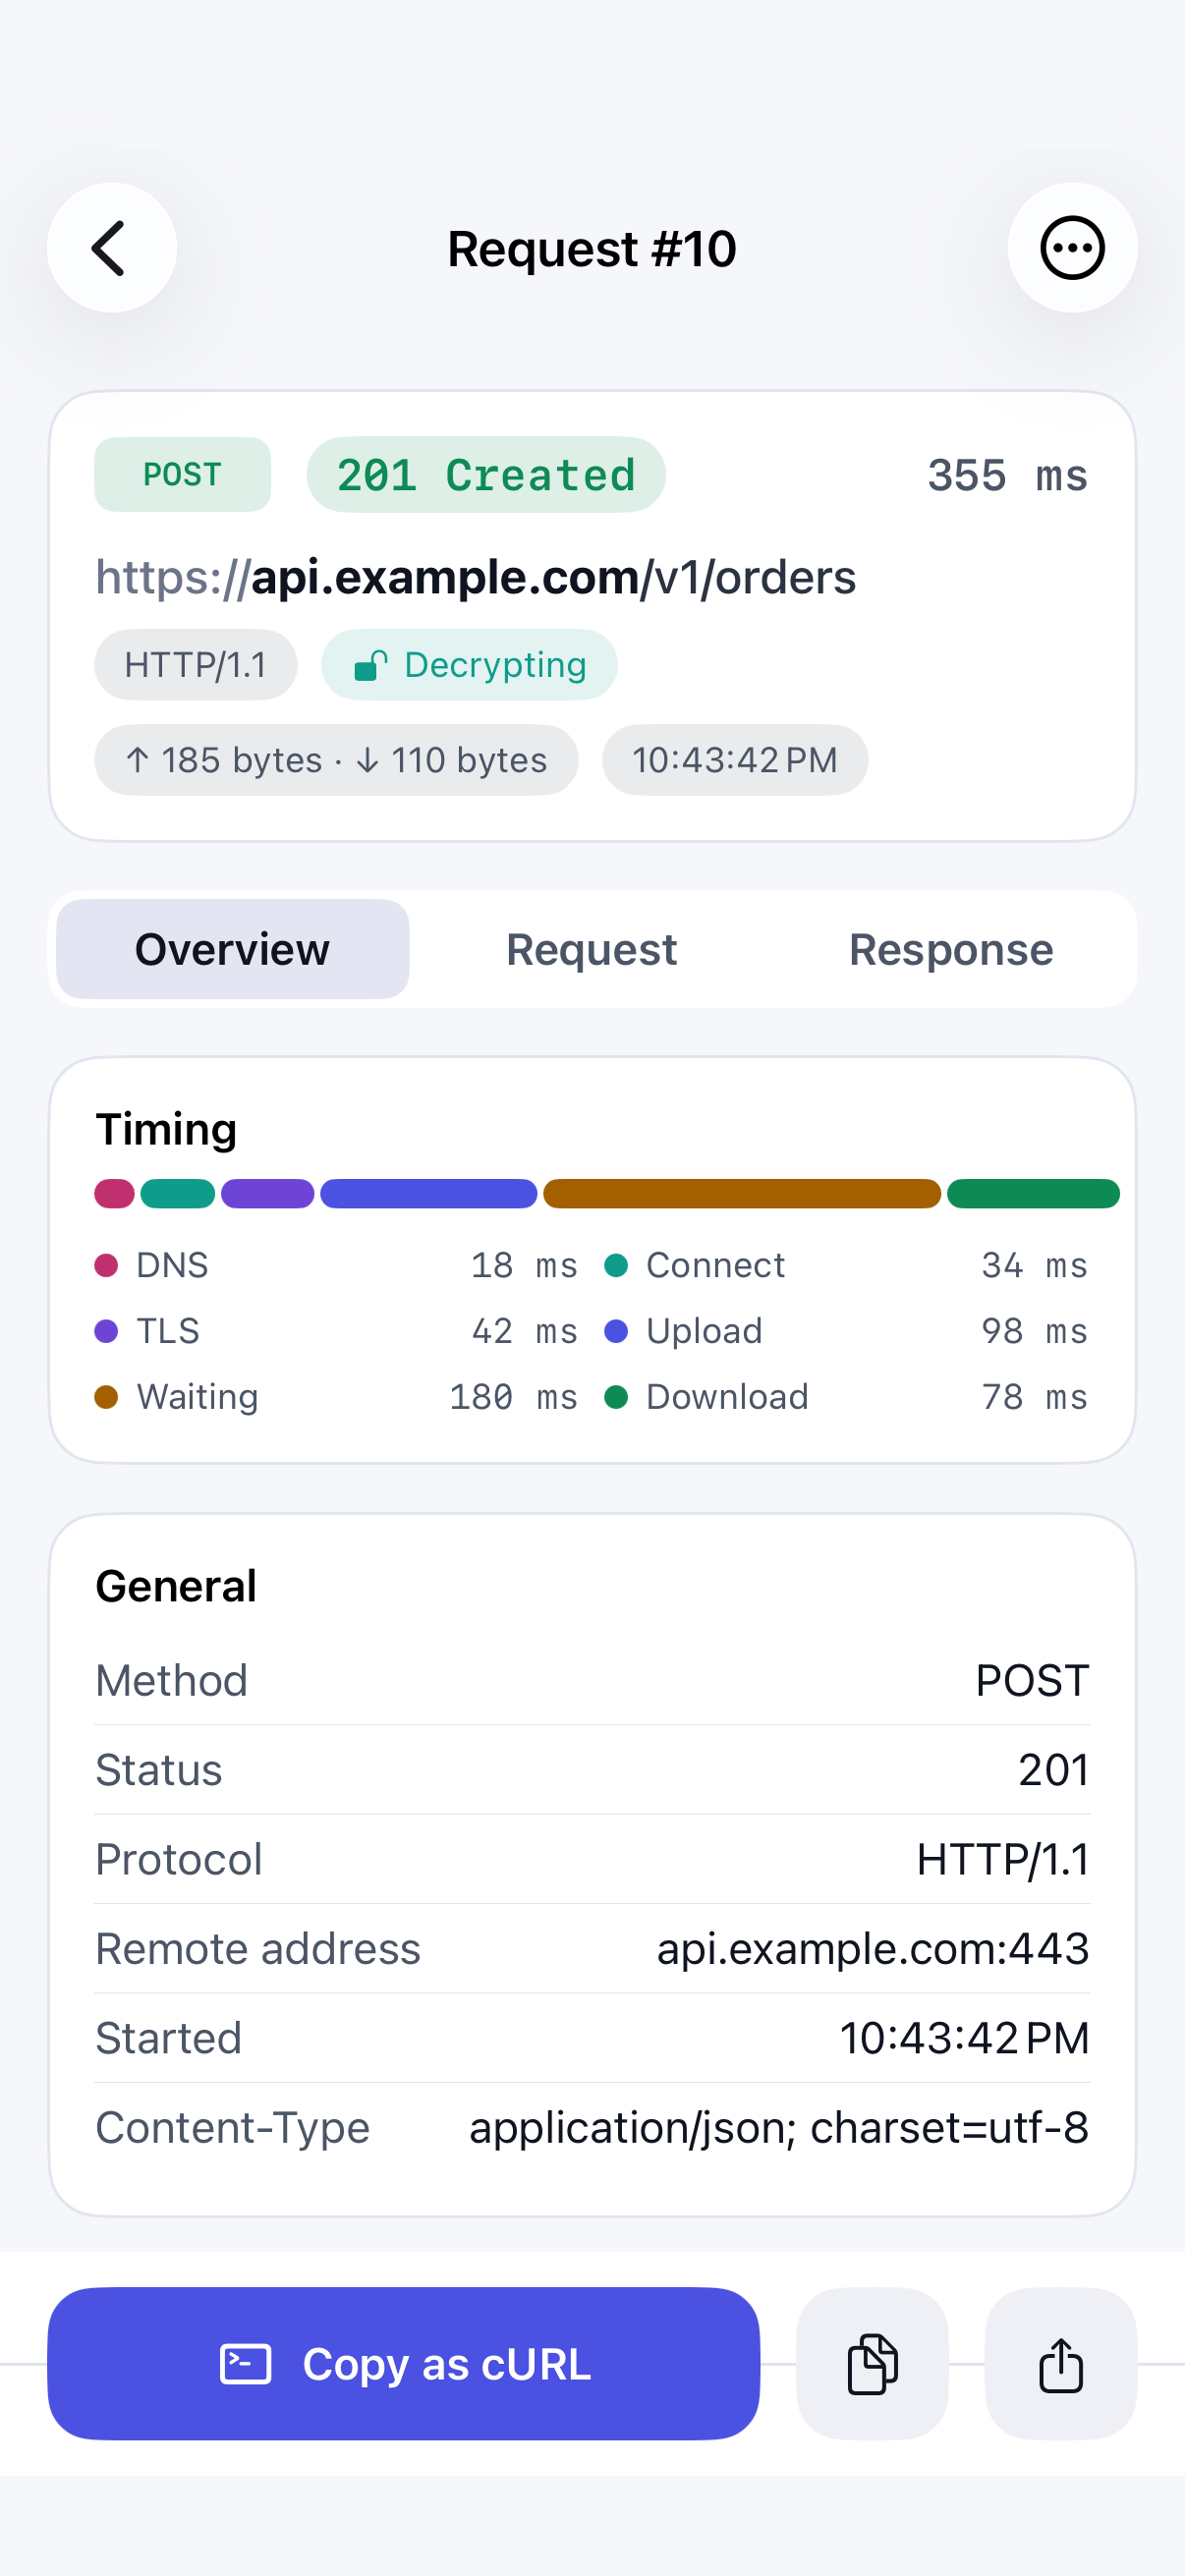
Open a request
Tap any row in the traffic list. The Overview tab shows the method, full URL, status, timing and size.
Step 02
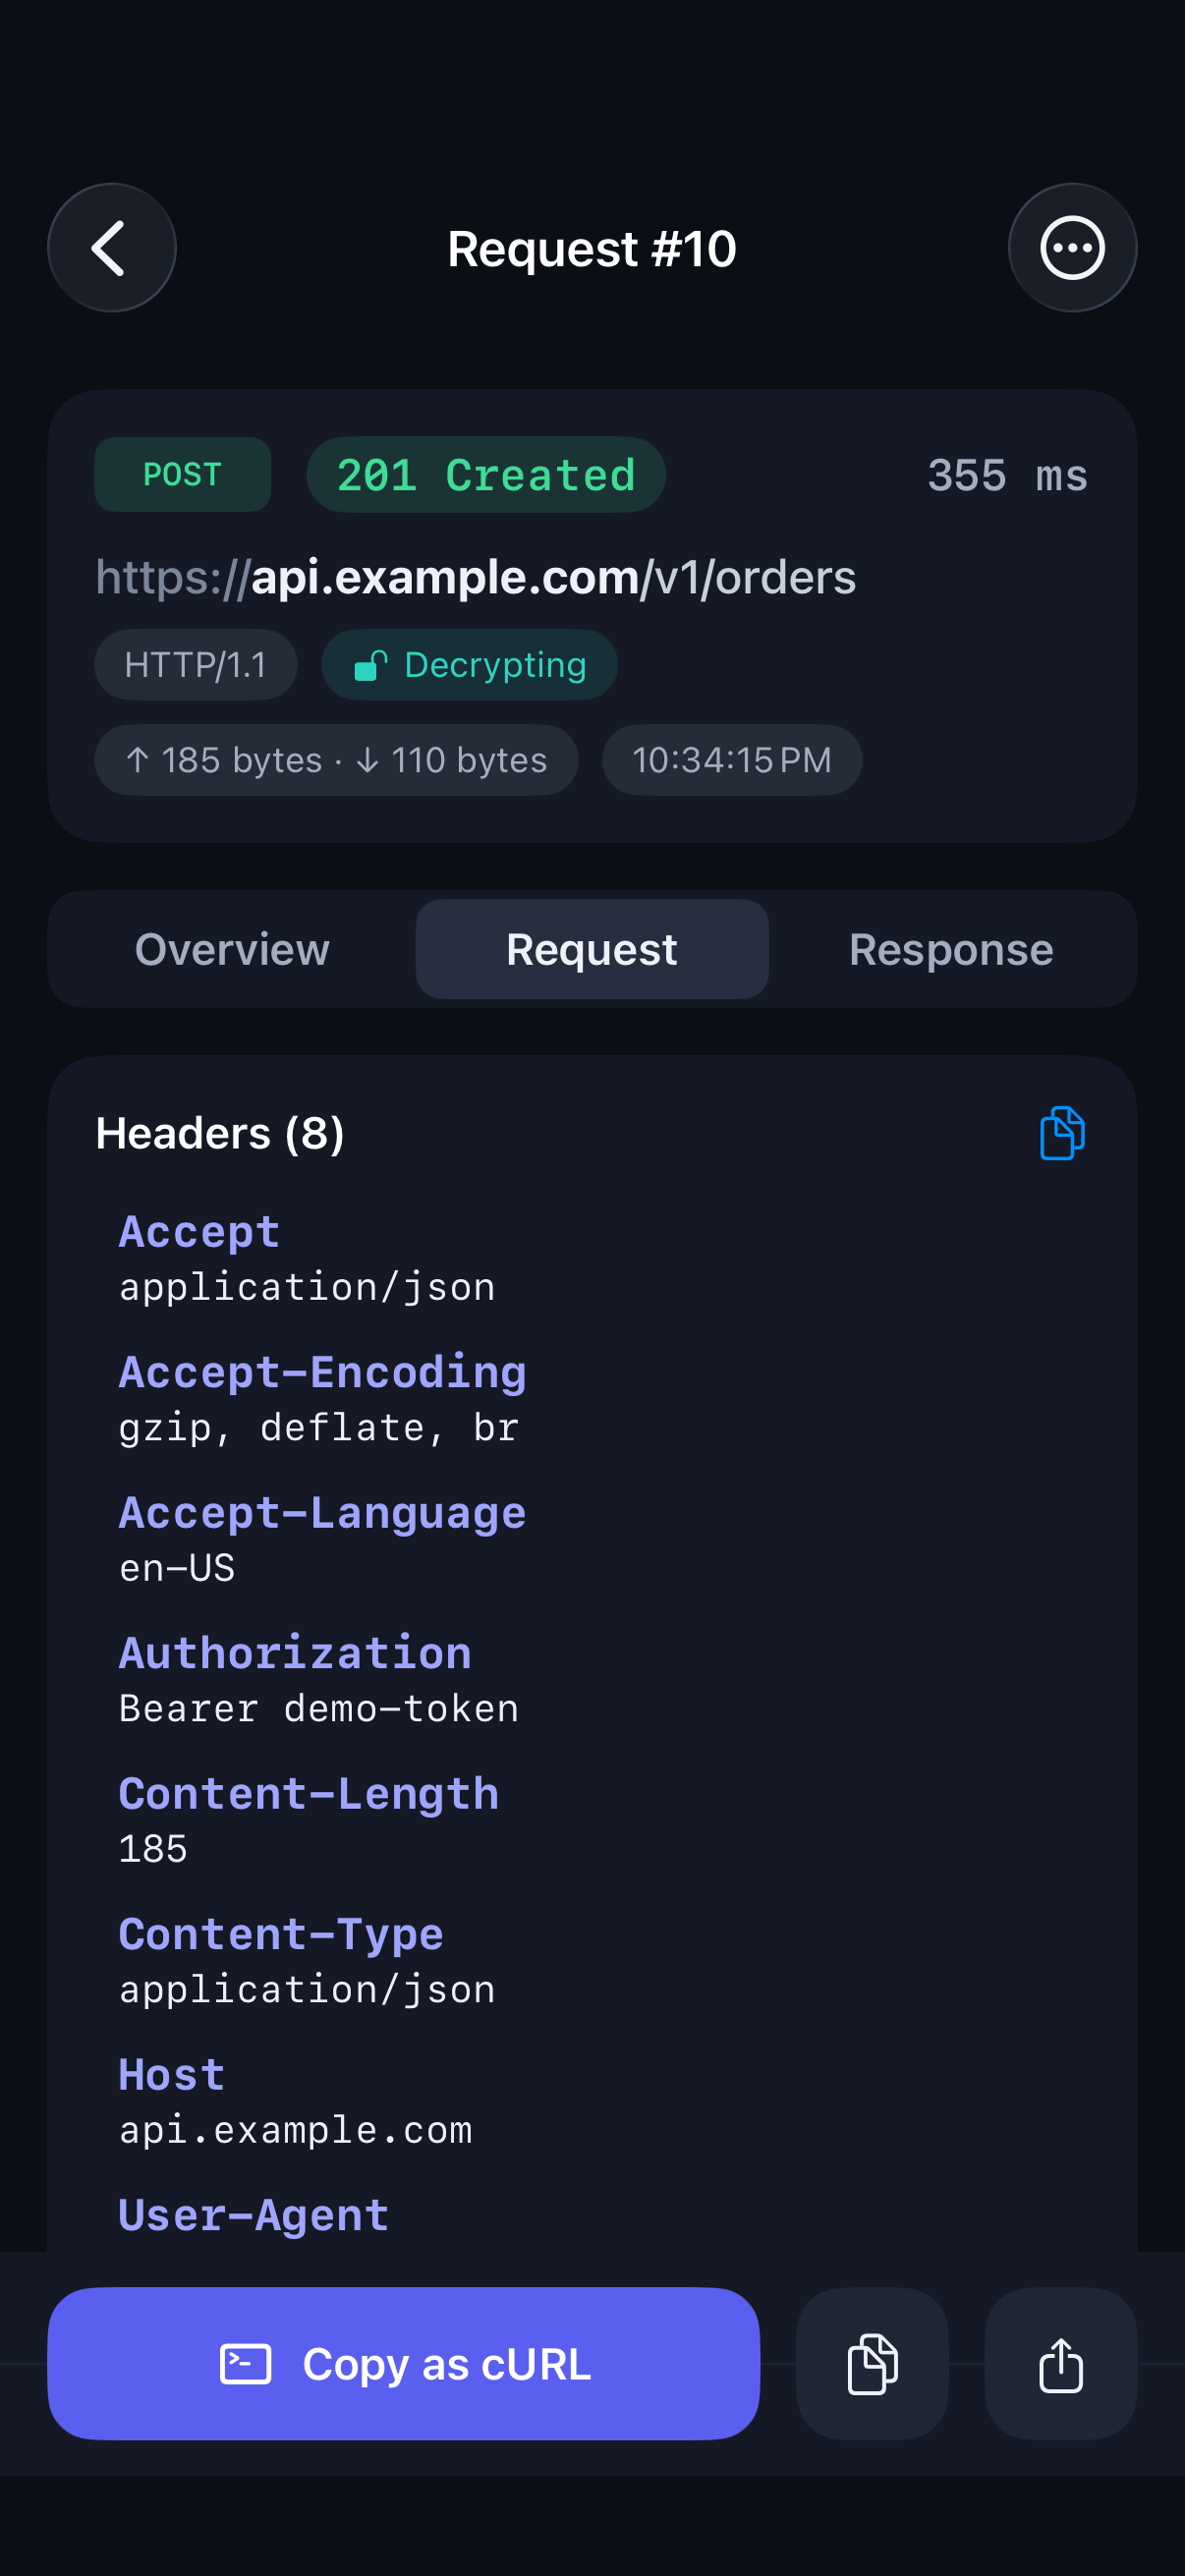
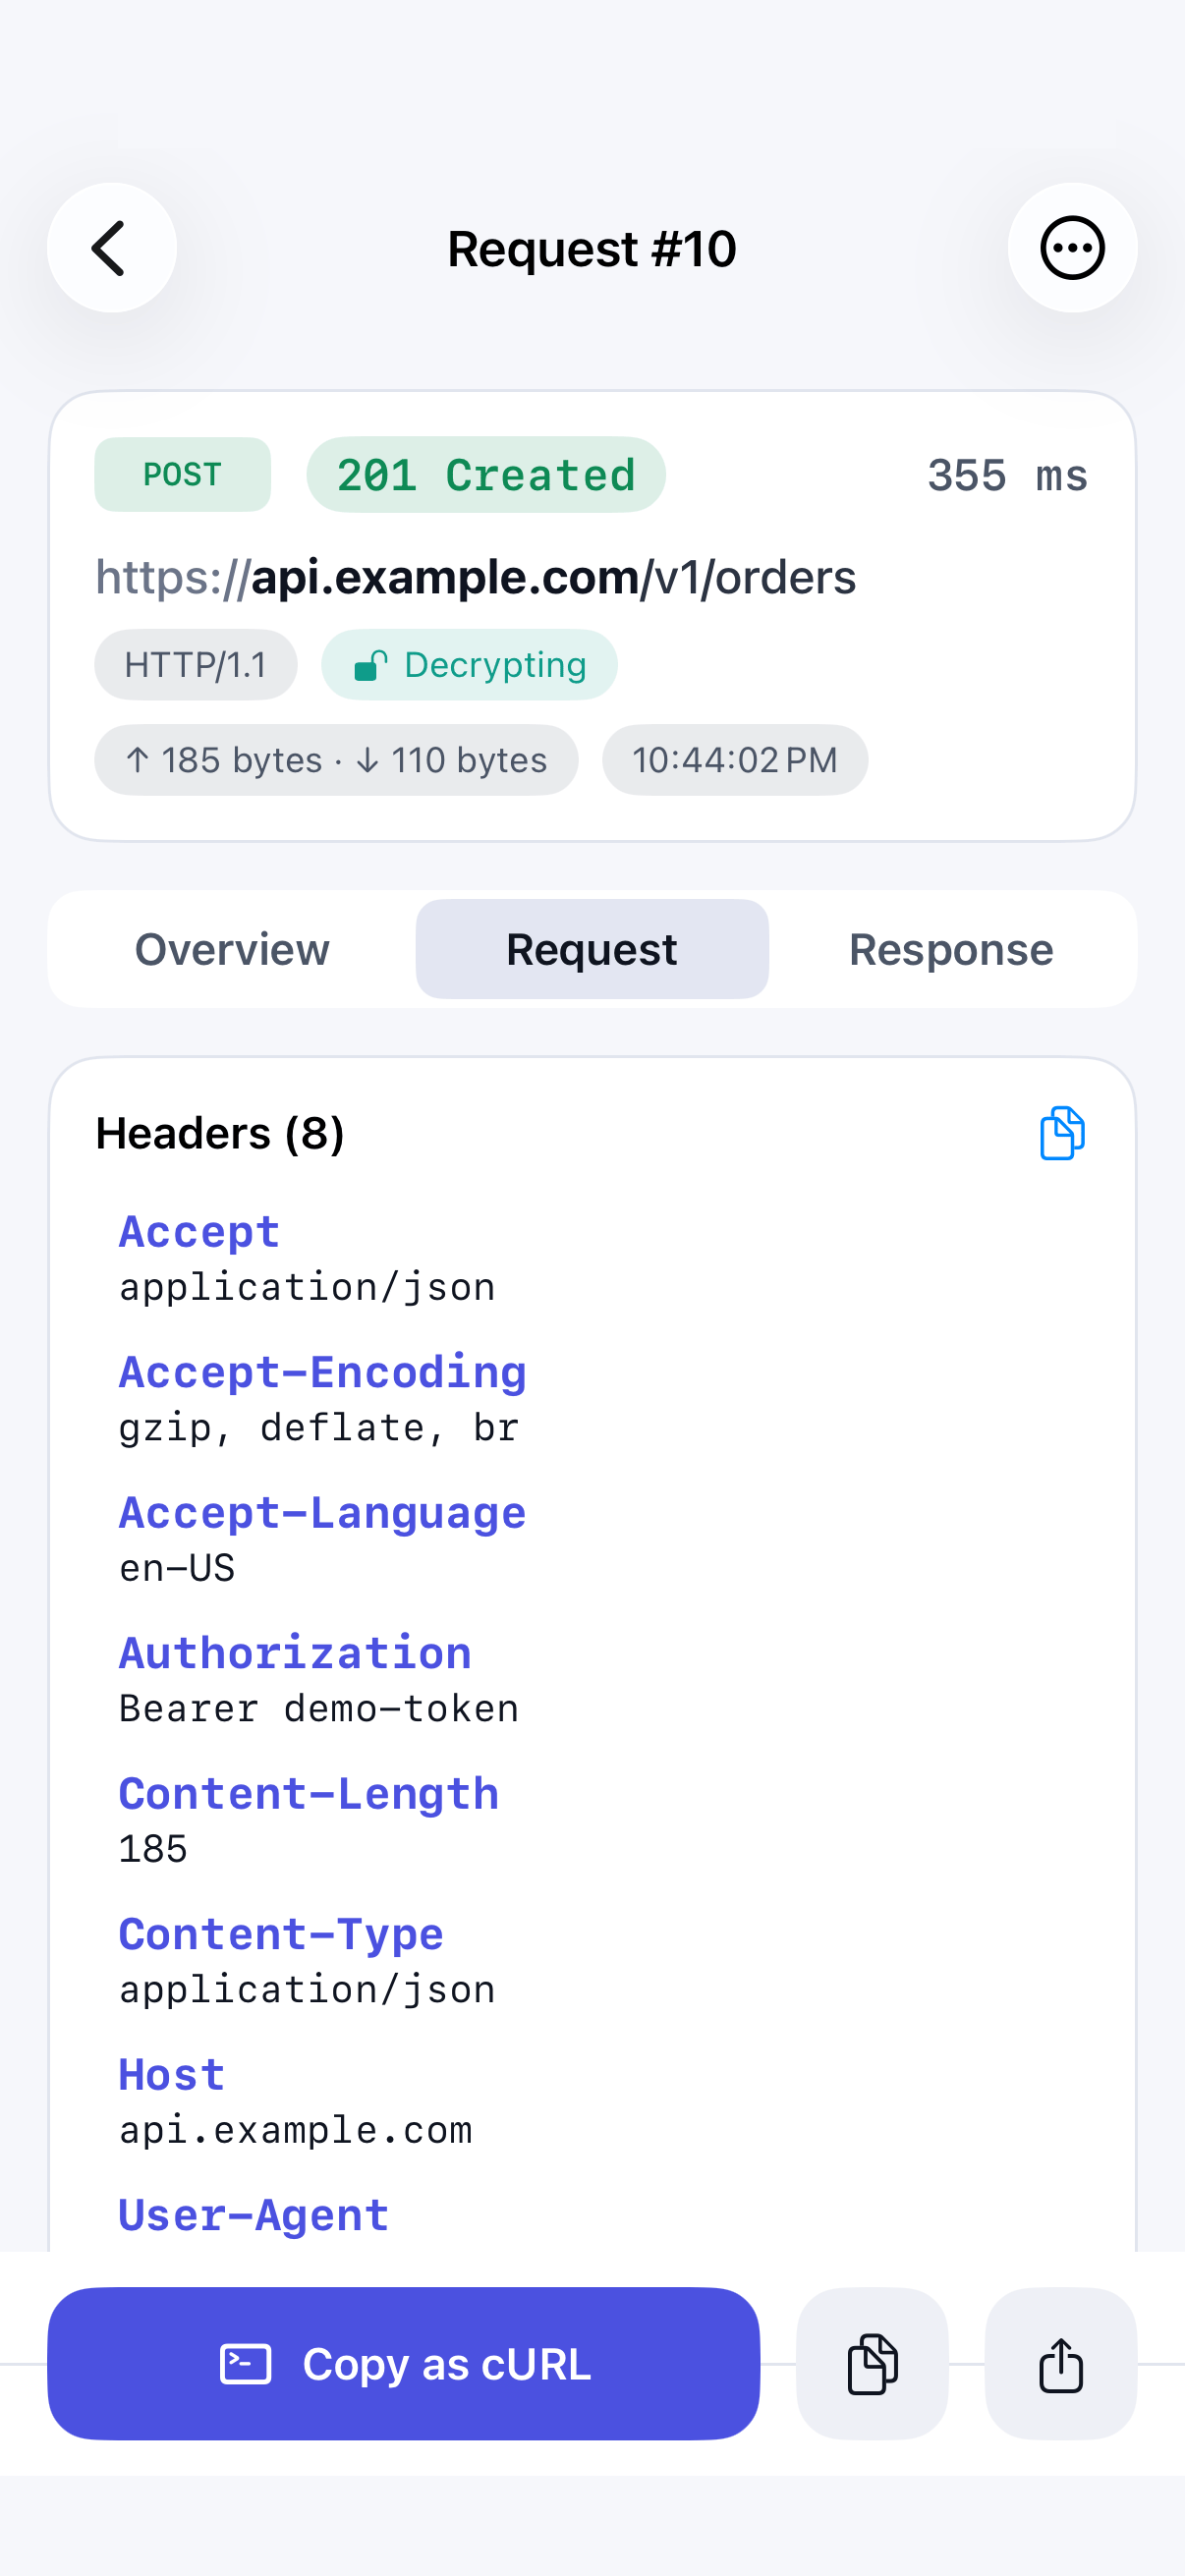
Check what your app sent
Switch to the Request tab to see every request header and the request body. Headers are counted, so a missing one stands out.
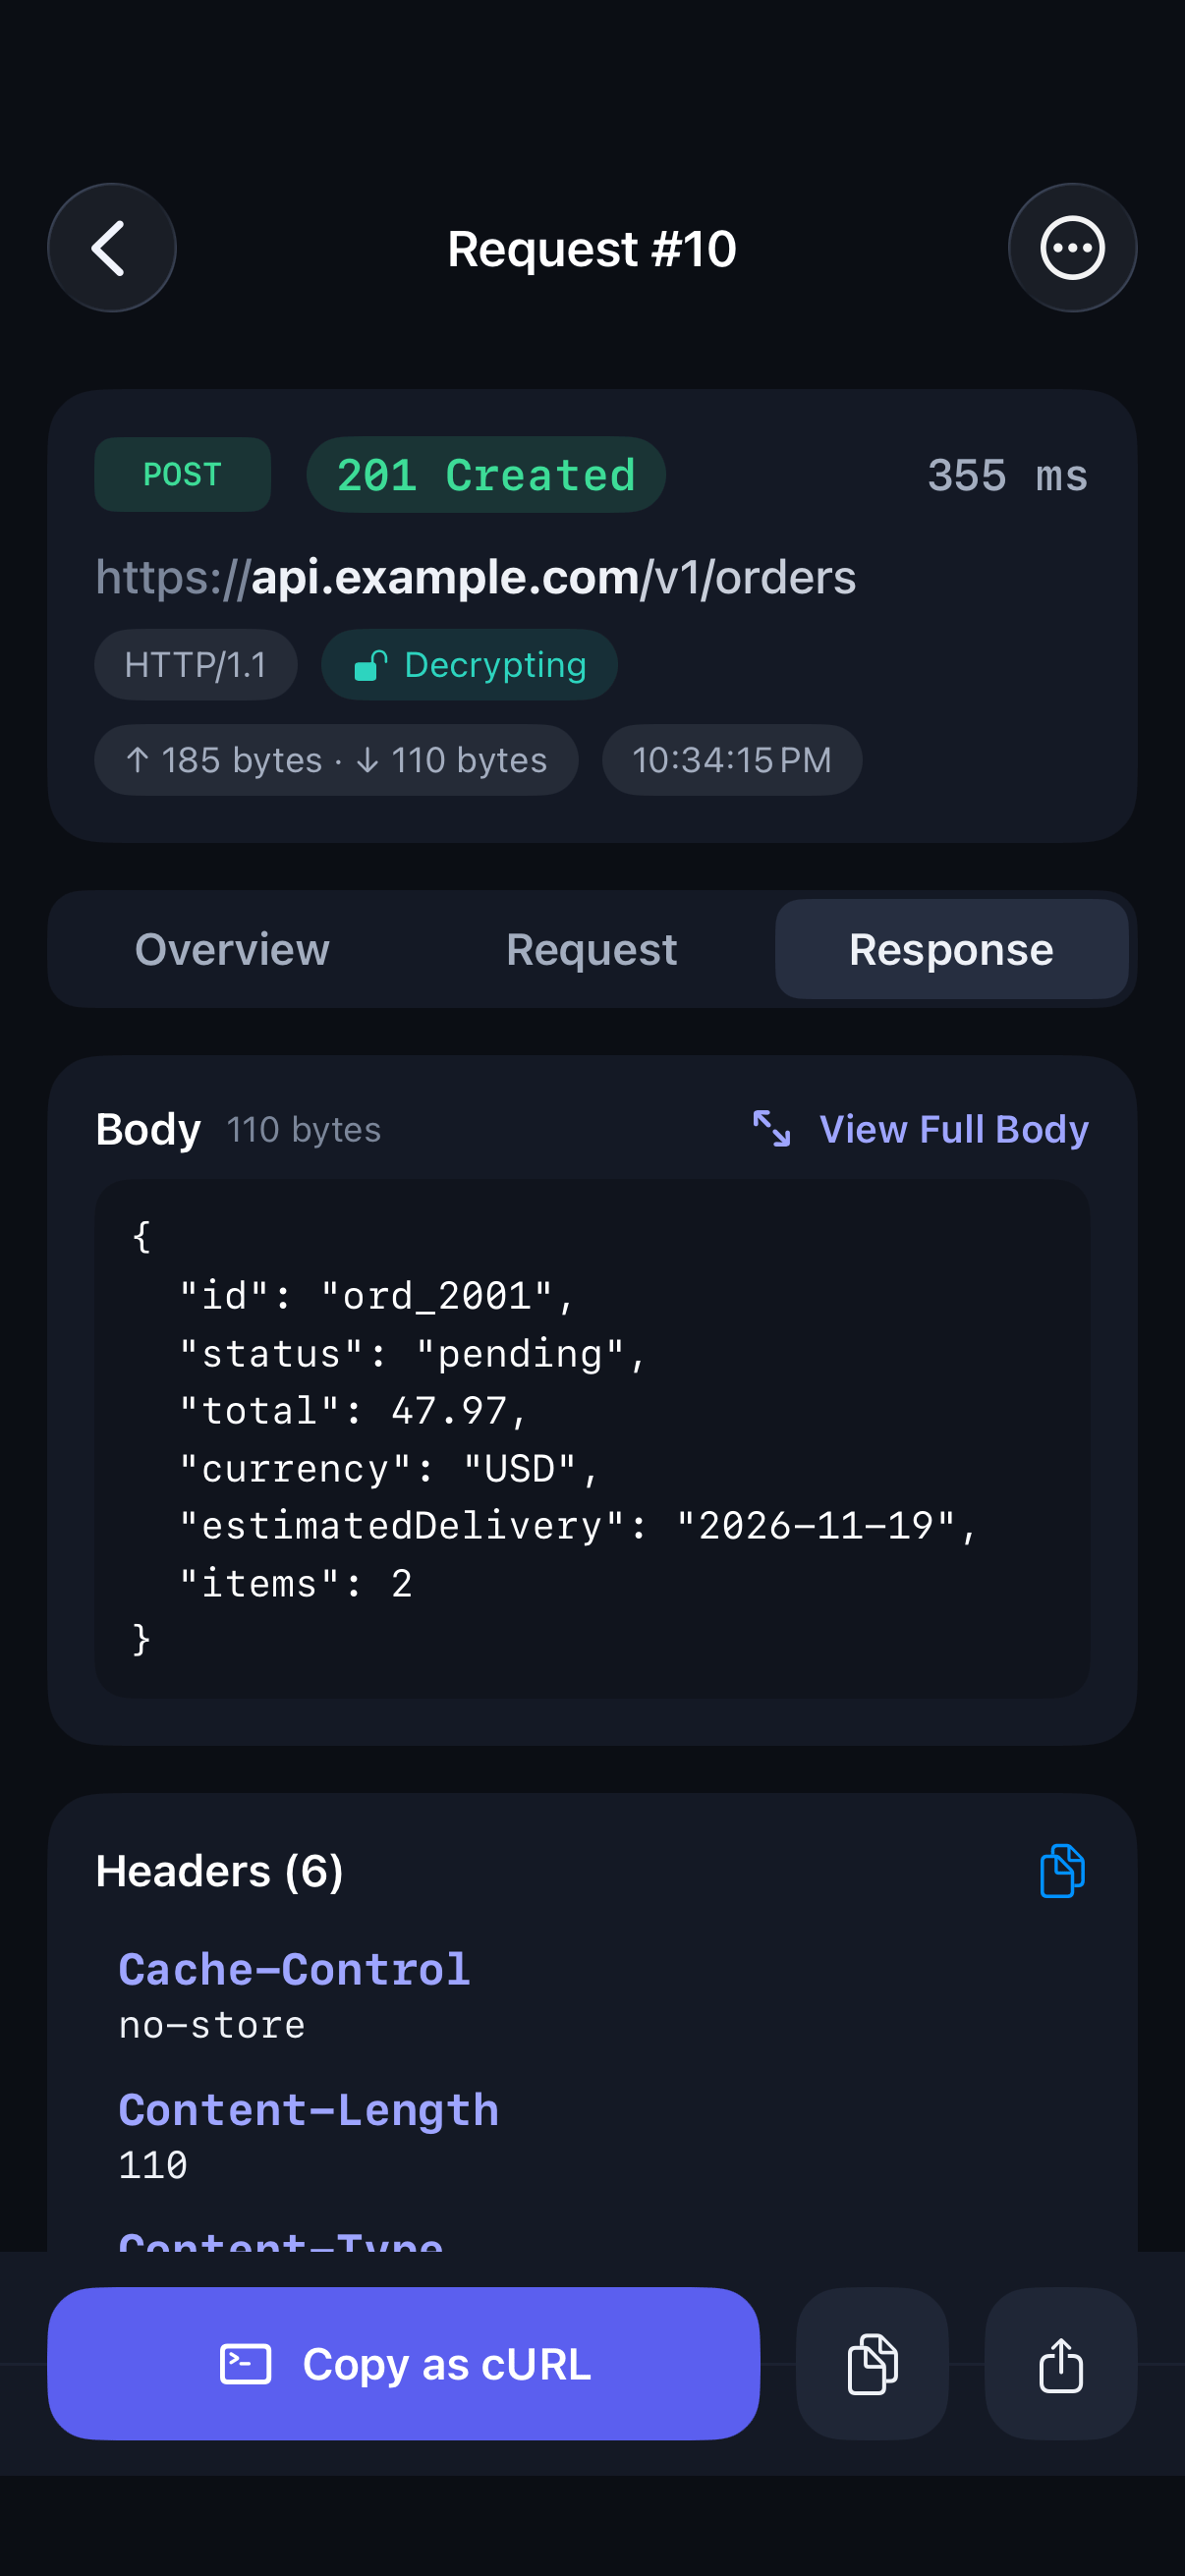
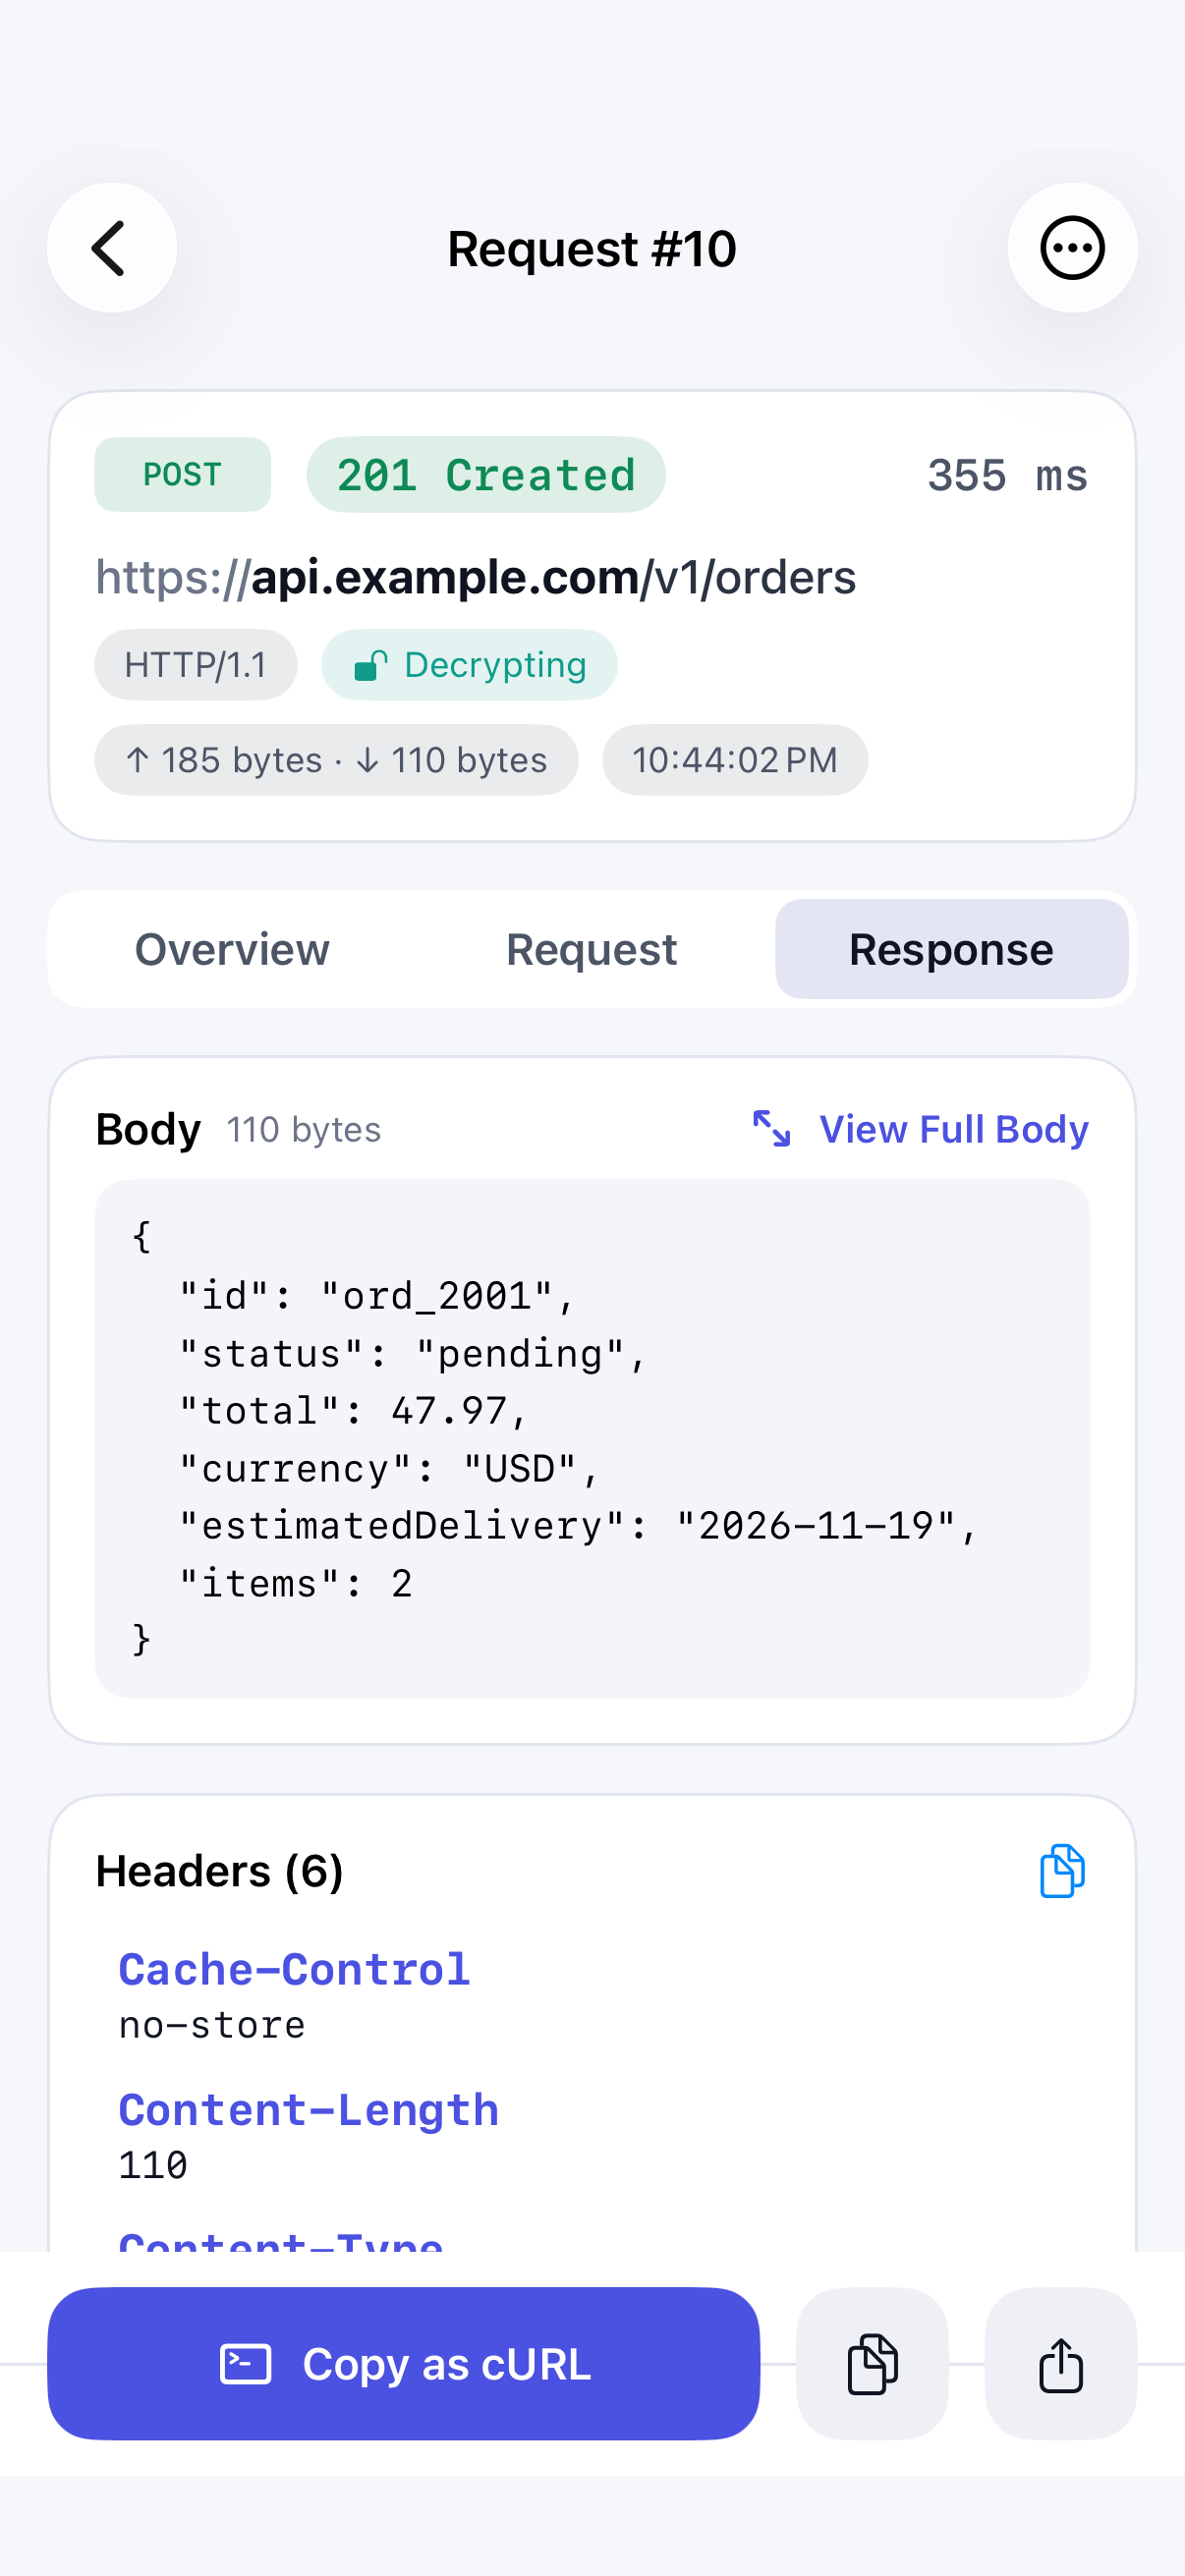
Step 03
Check what came back
Switch to the Response tab for the response headers and body. JSON bodies are formatted automatically.
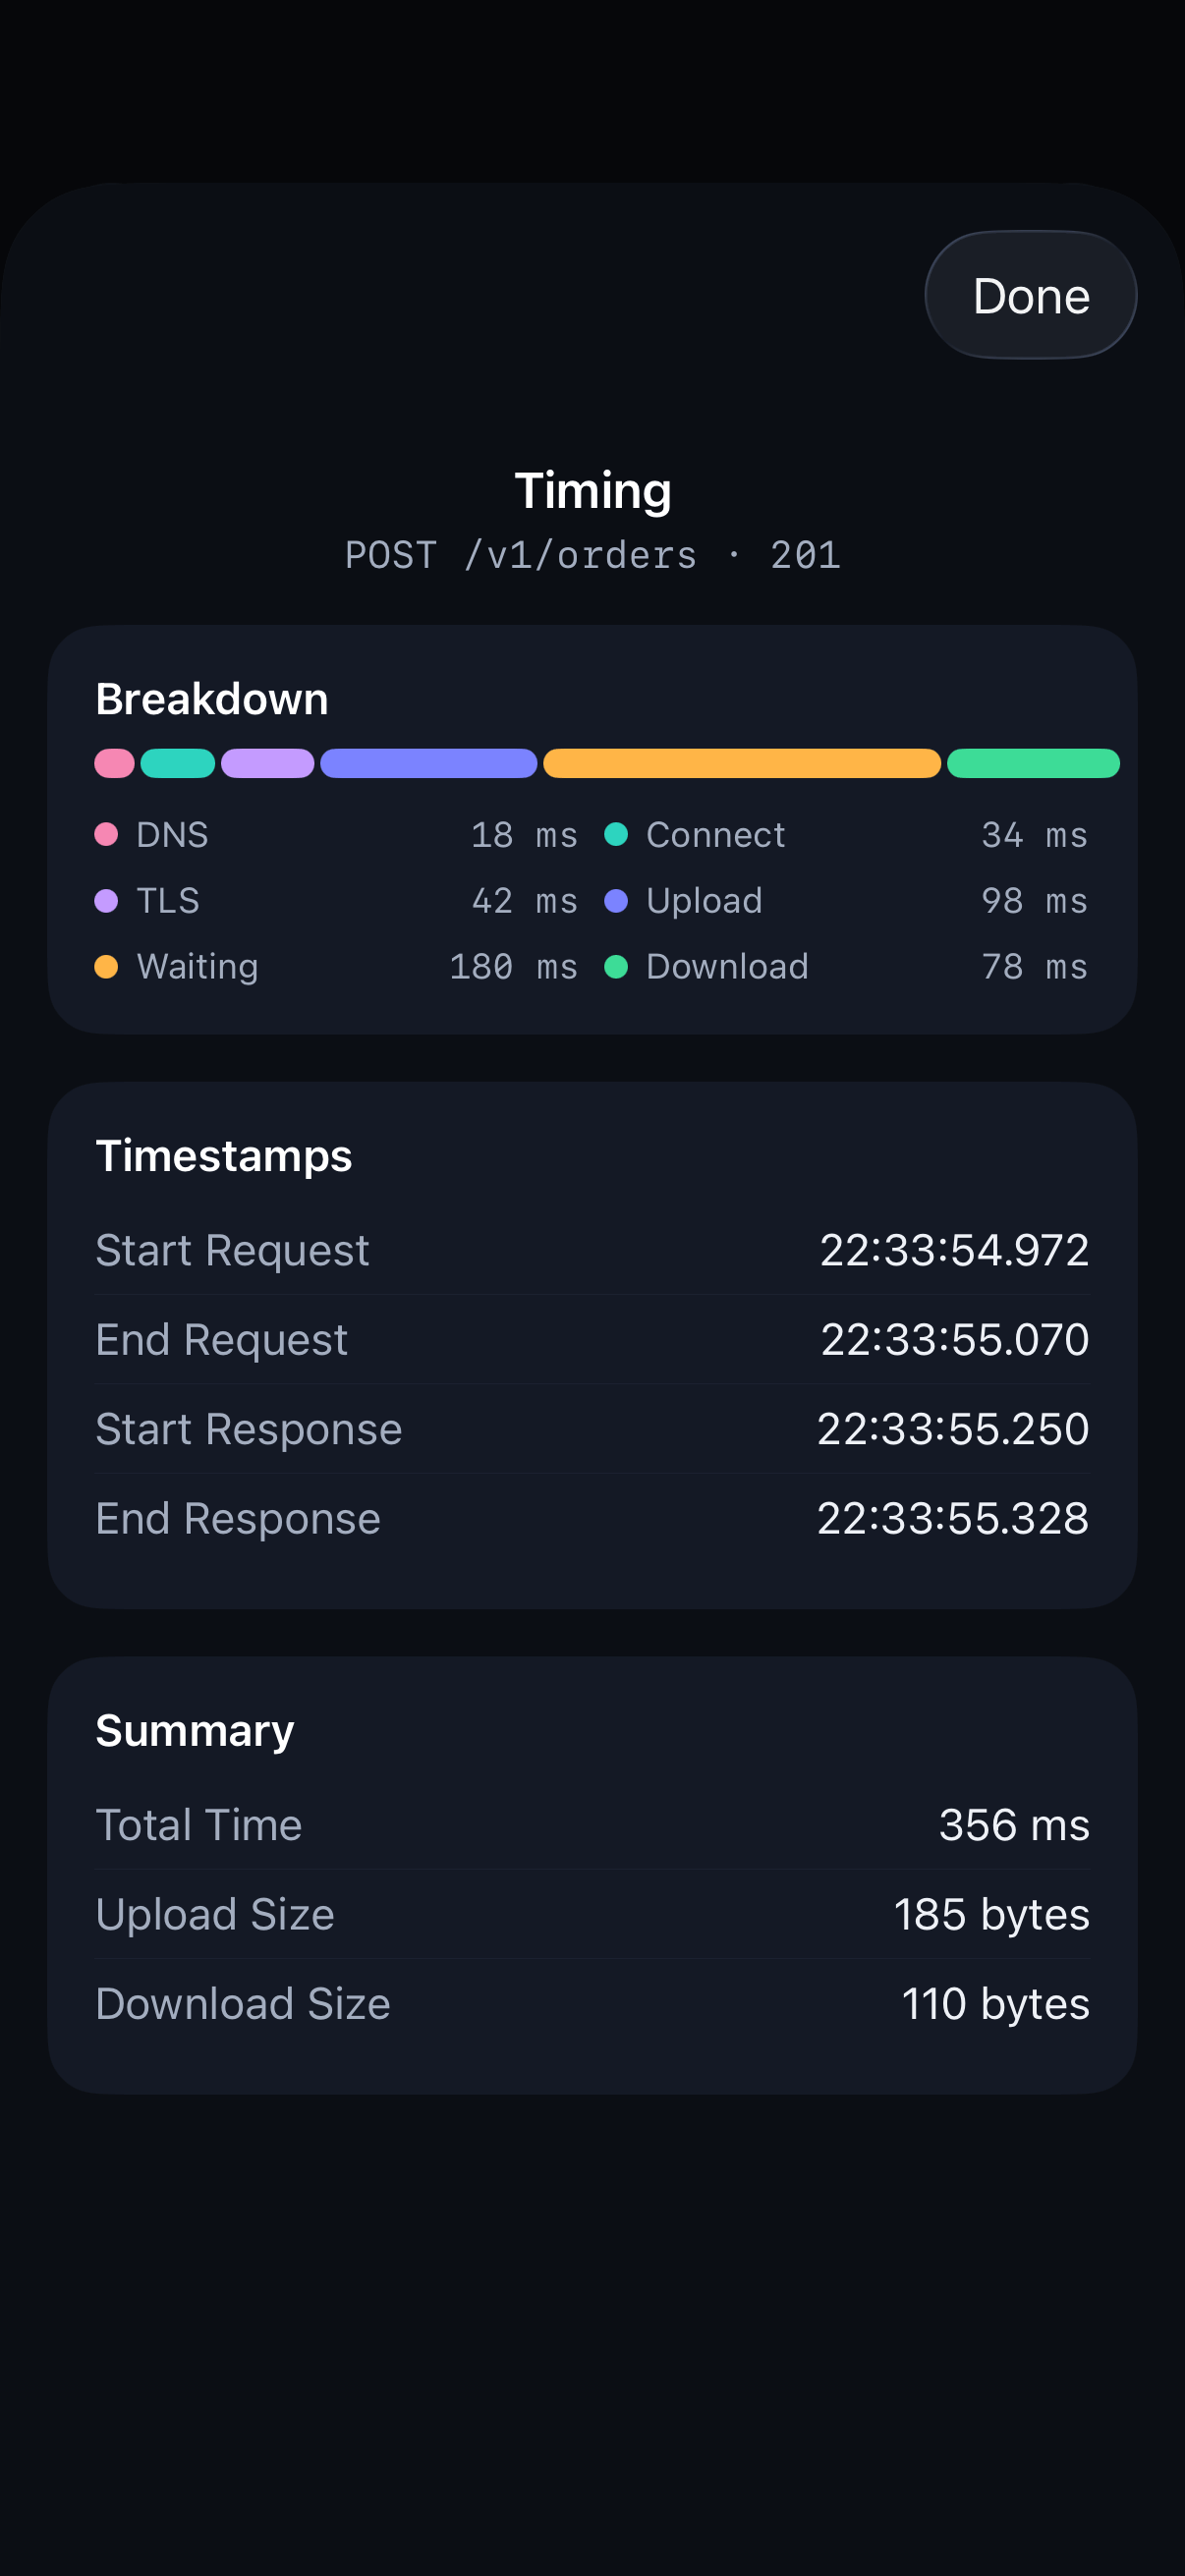
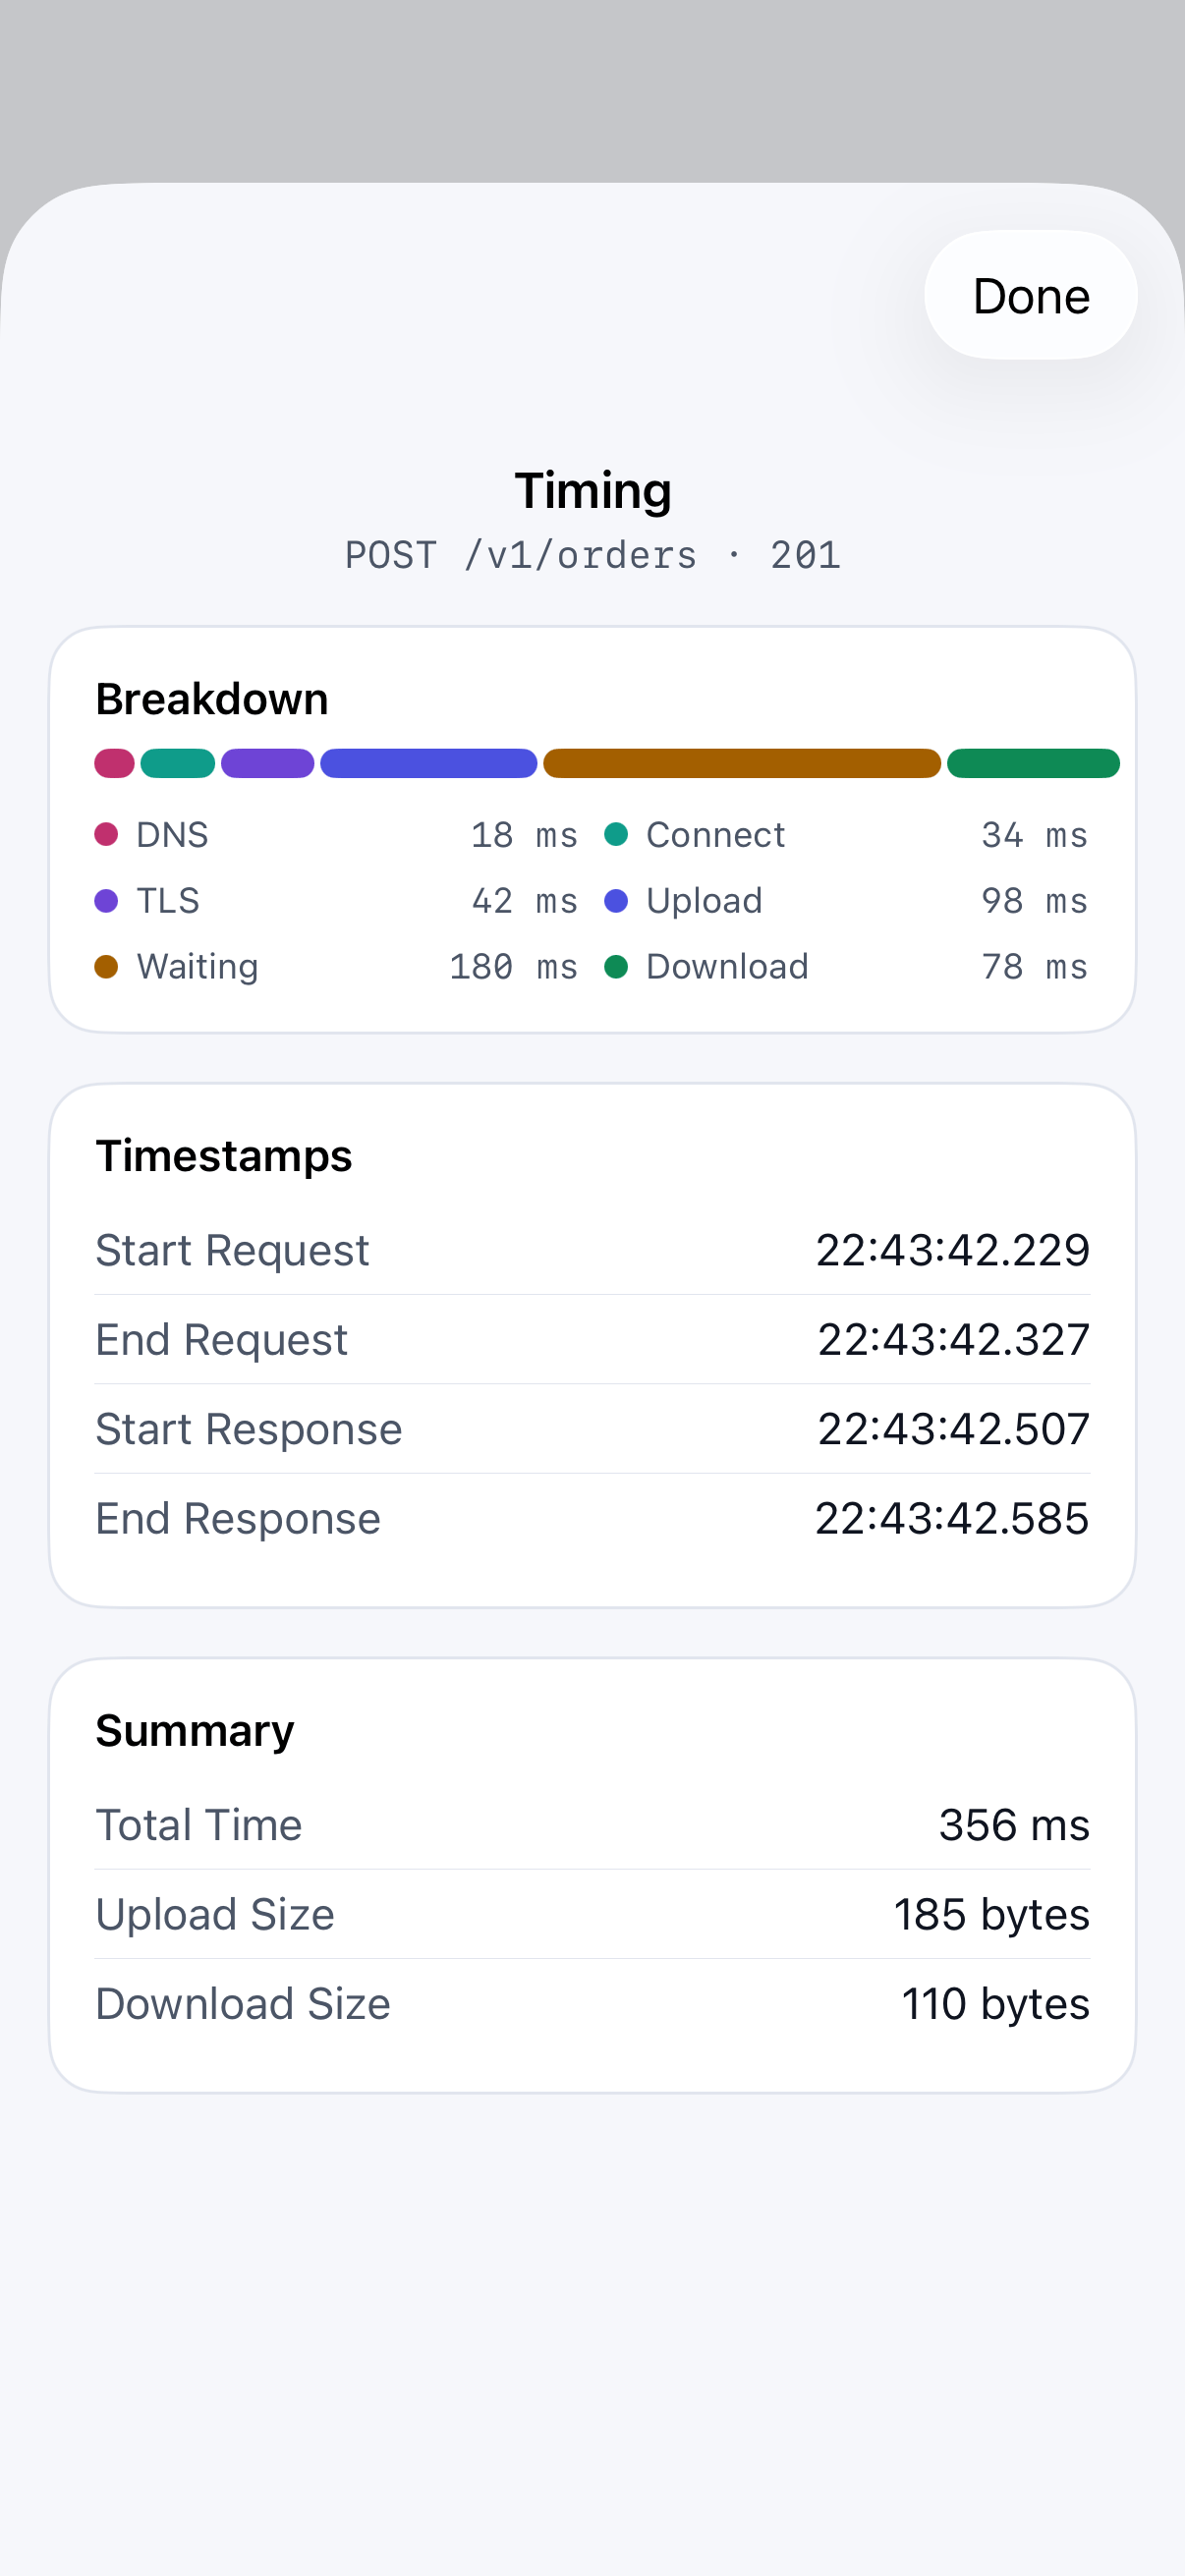
Step 04
See where the time went
The timing breakdown shows how long each phase of the call took. Use it to tell a slow server from a slow connection.
Step 05
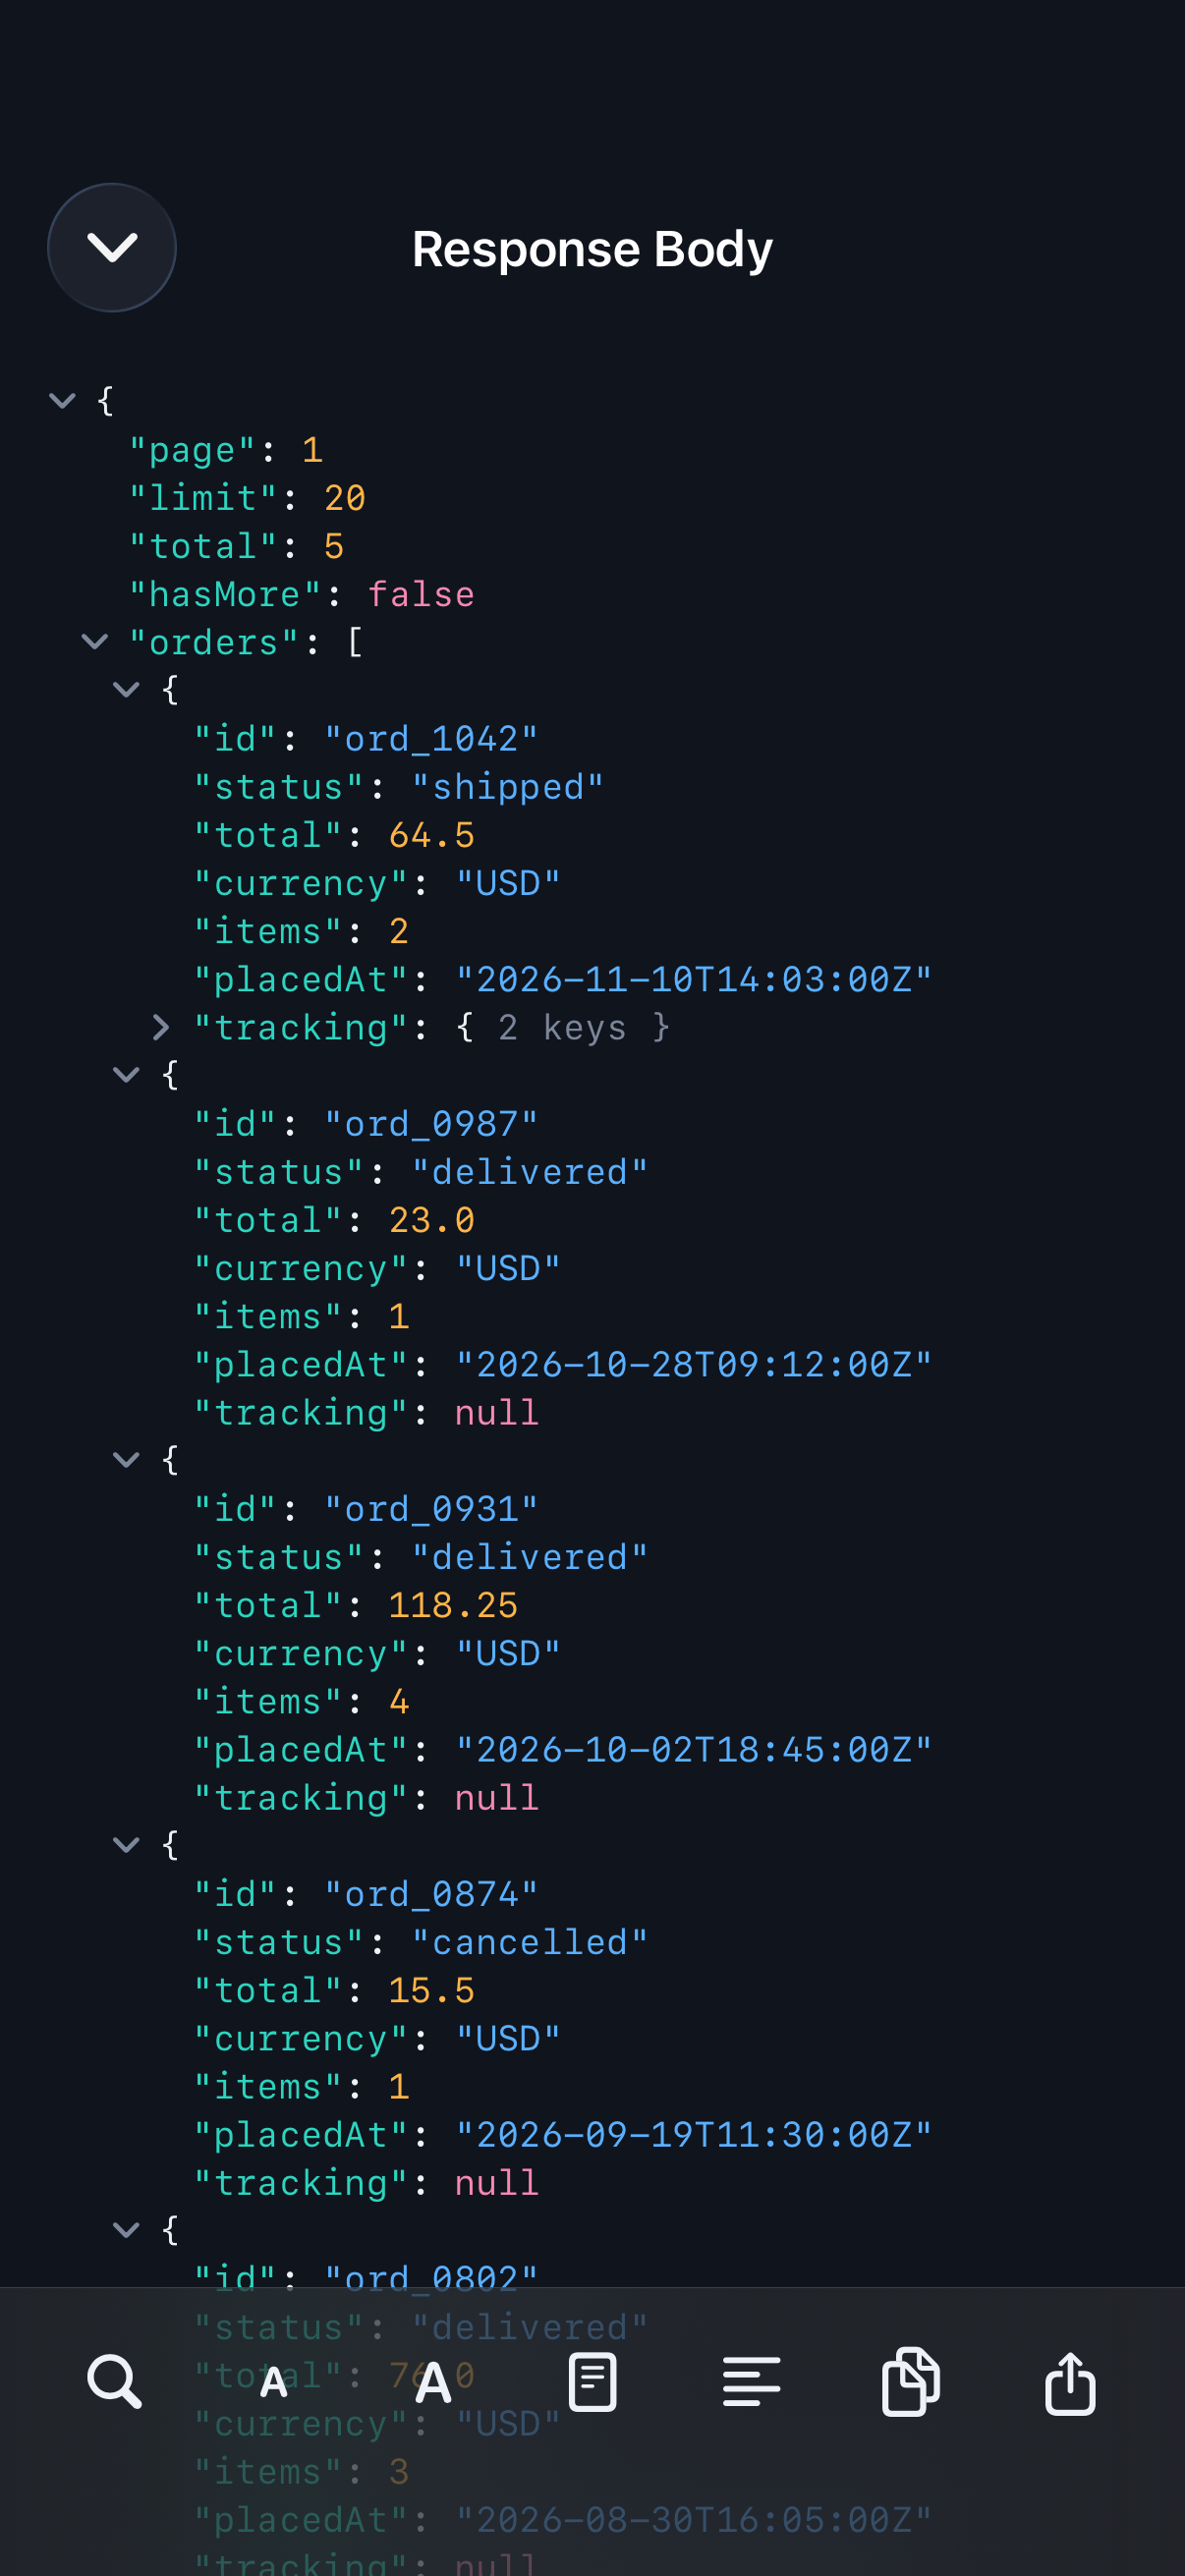
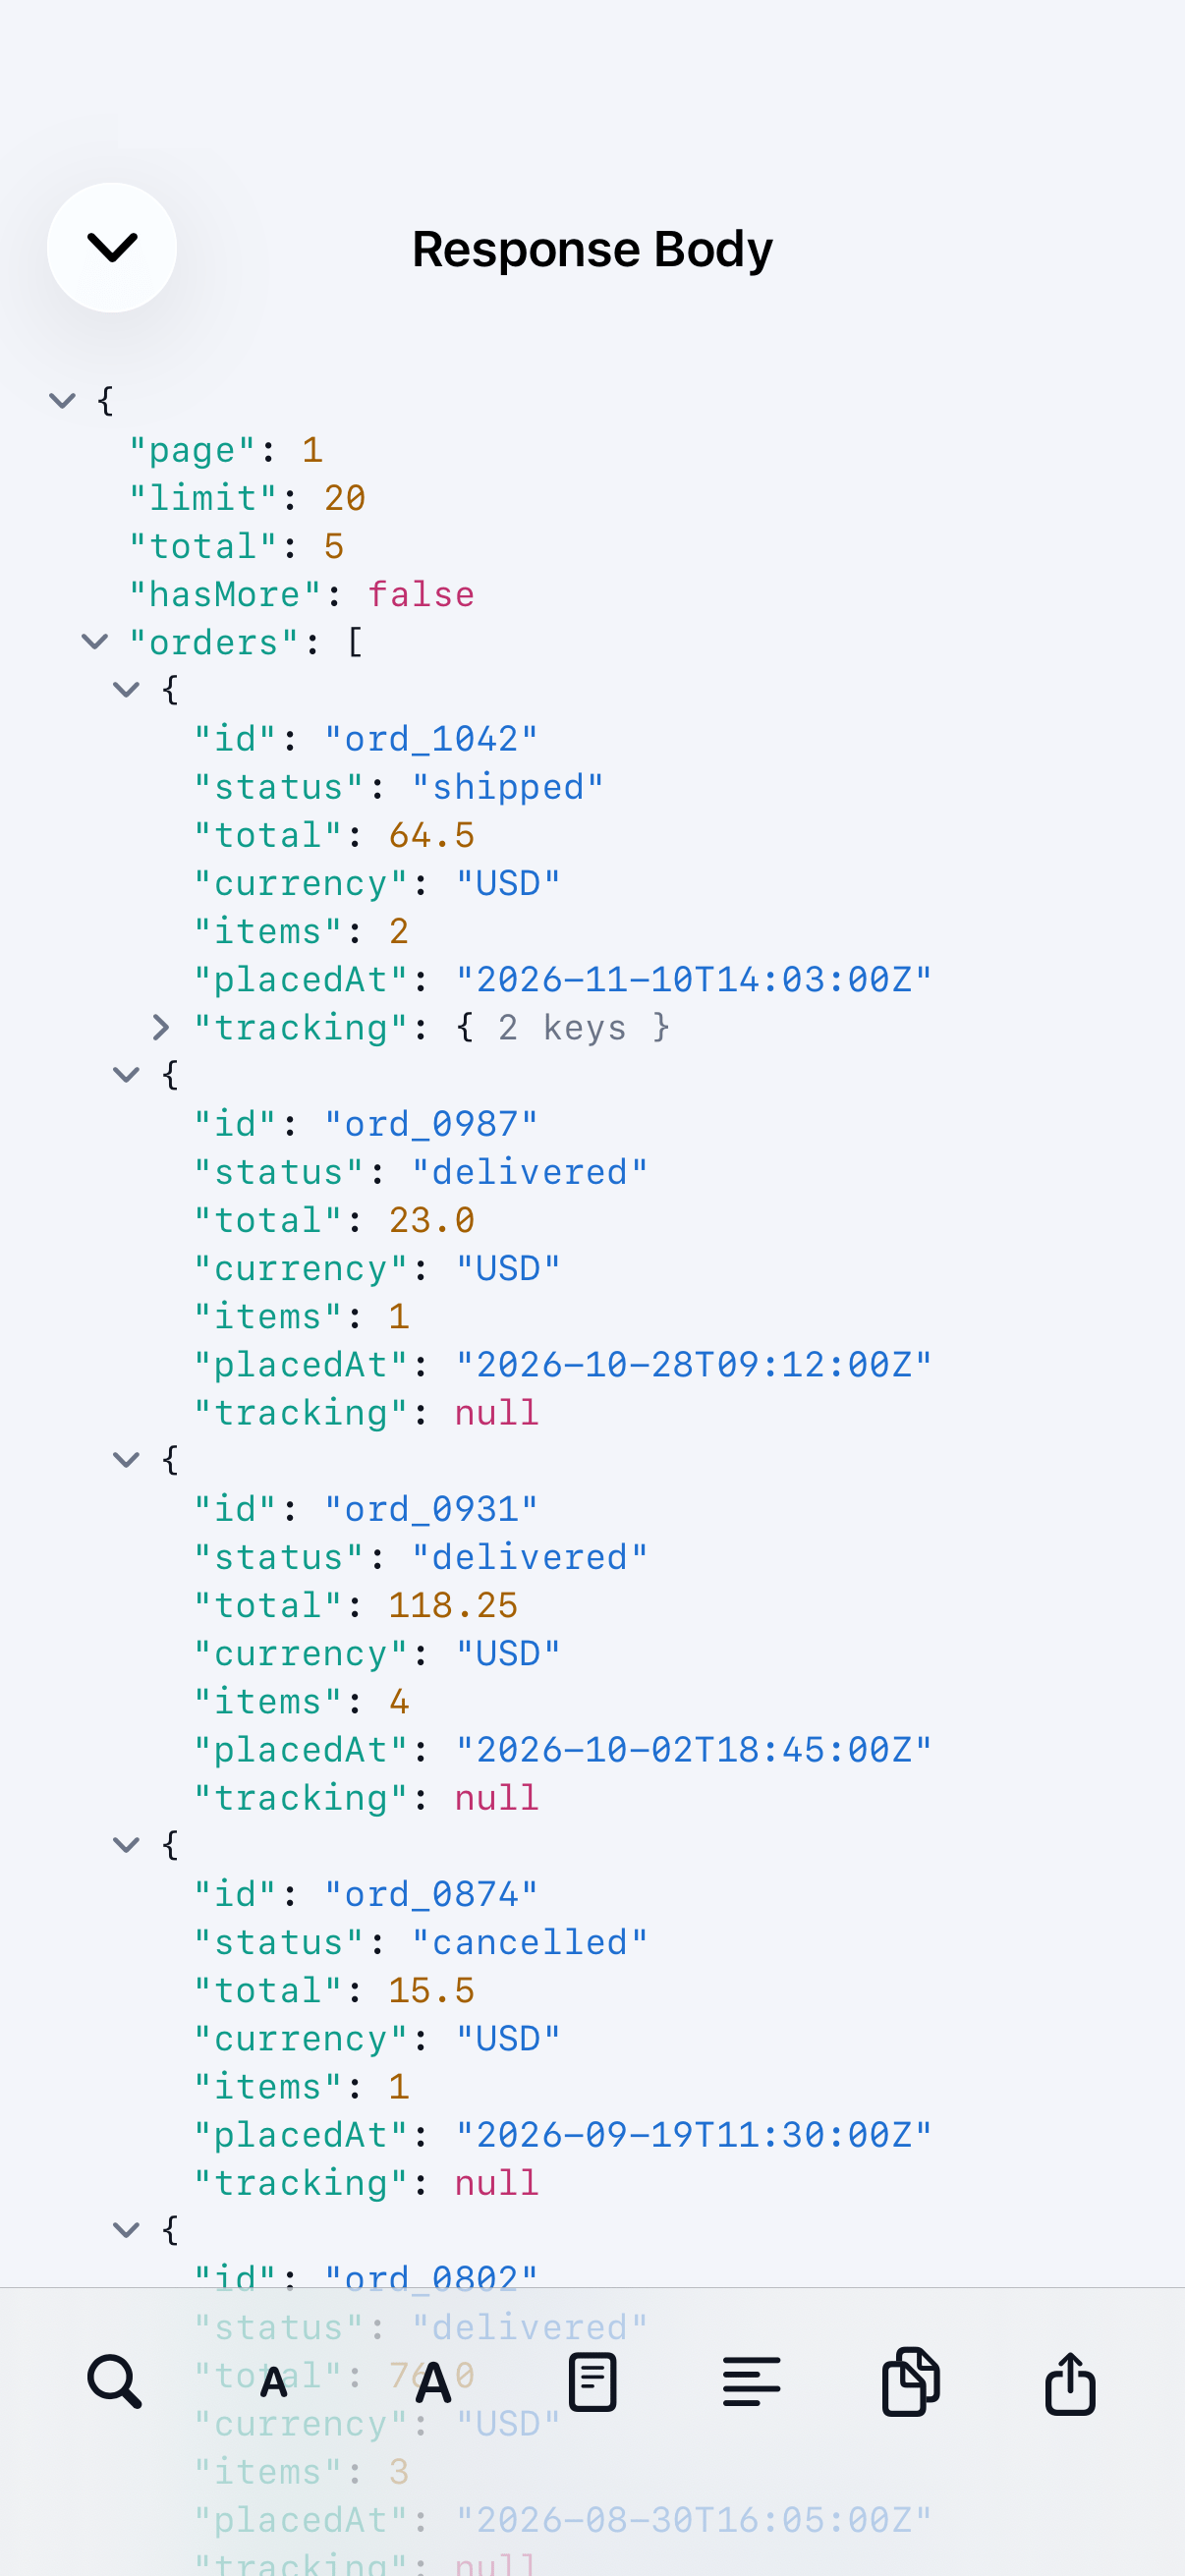
Fold and unfold JSON
JSON bodies appear as a tree. Collapse the sections you don't need to keep a large payload readable.
Step 06
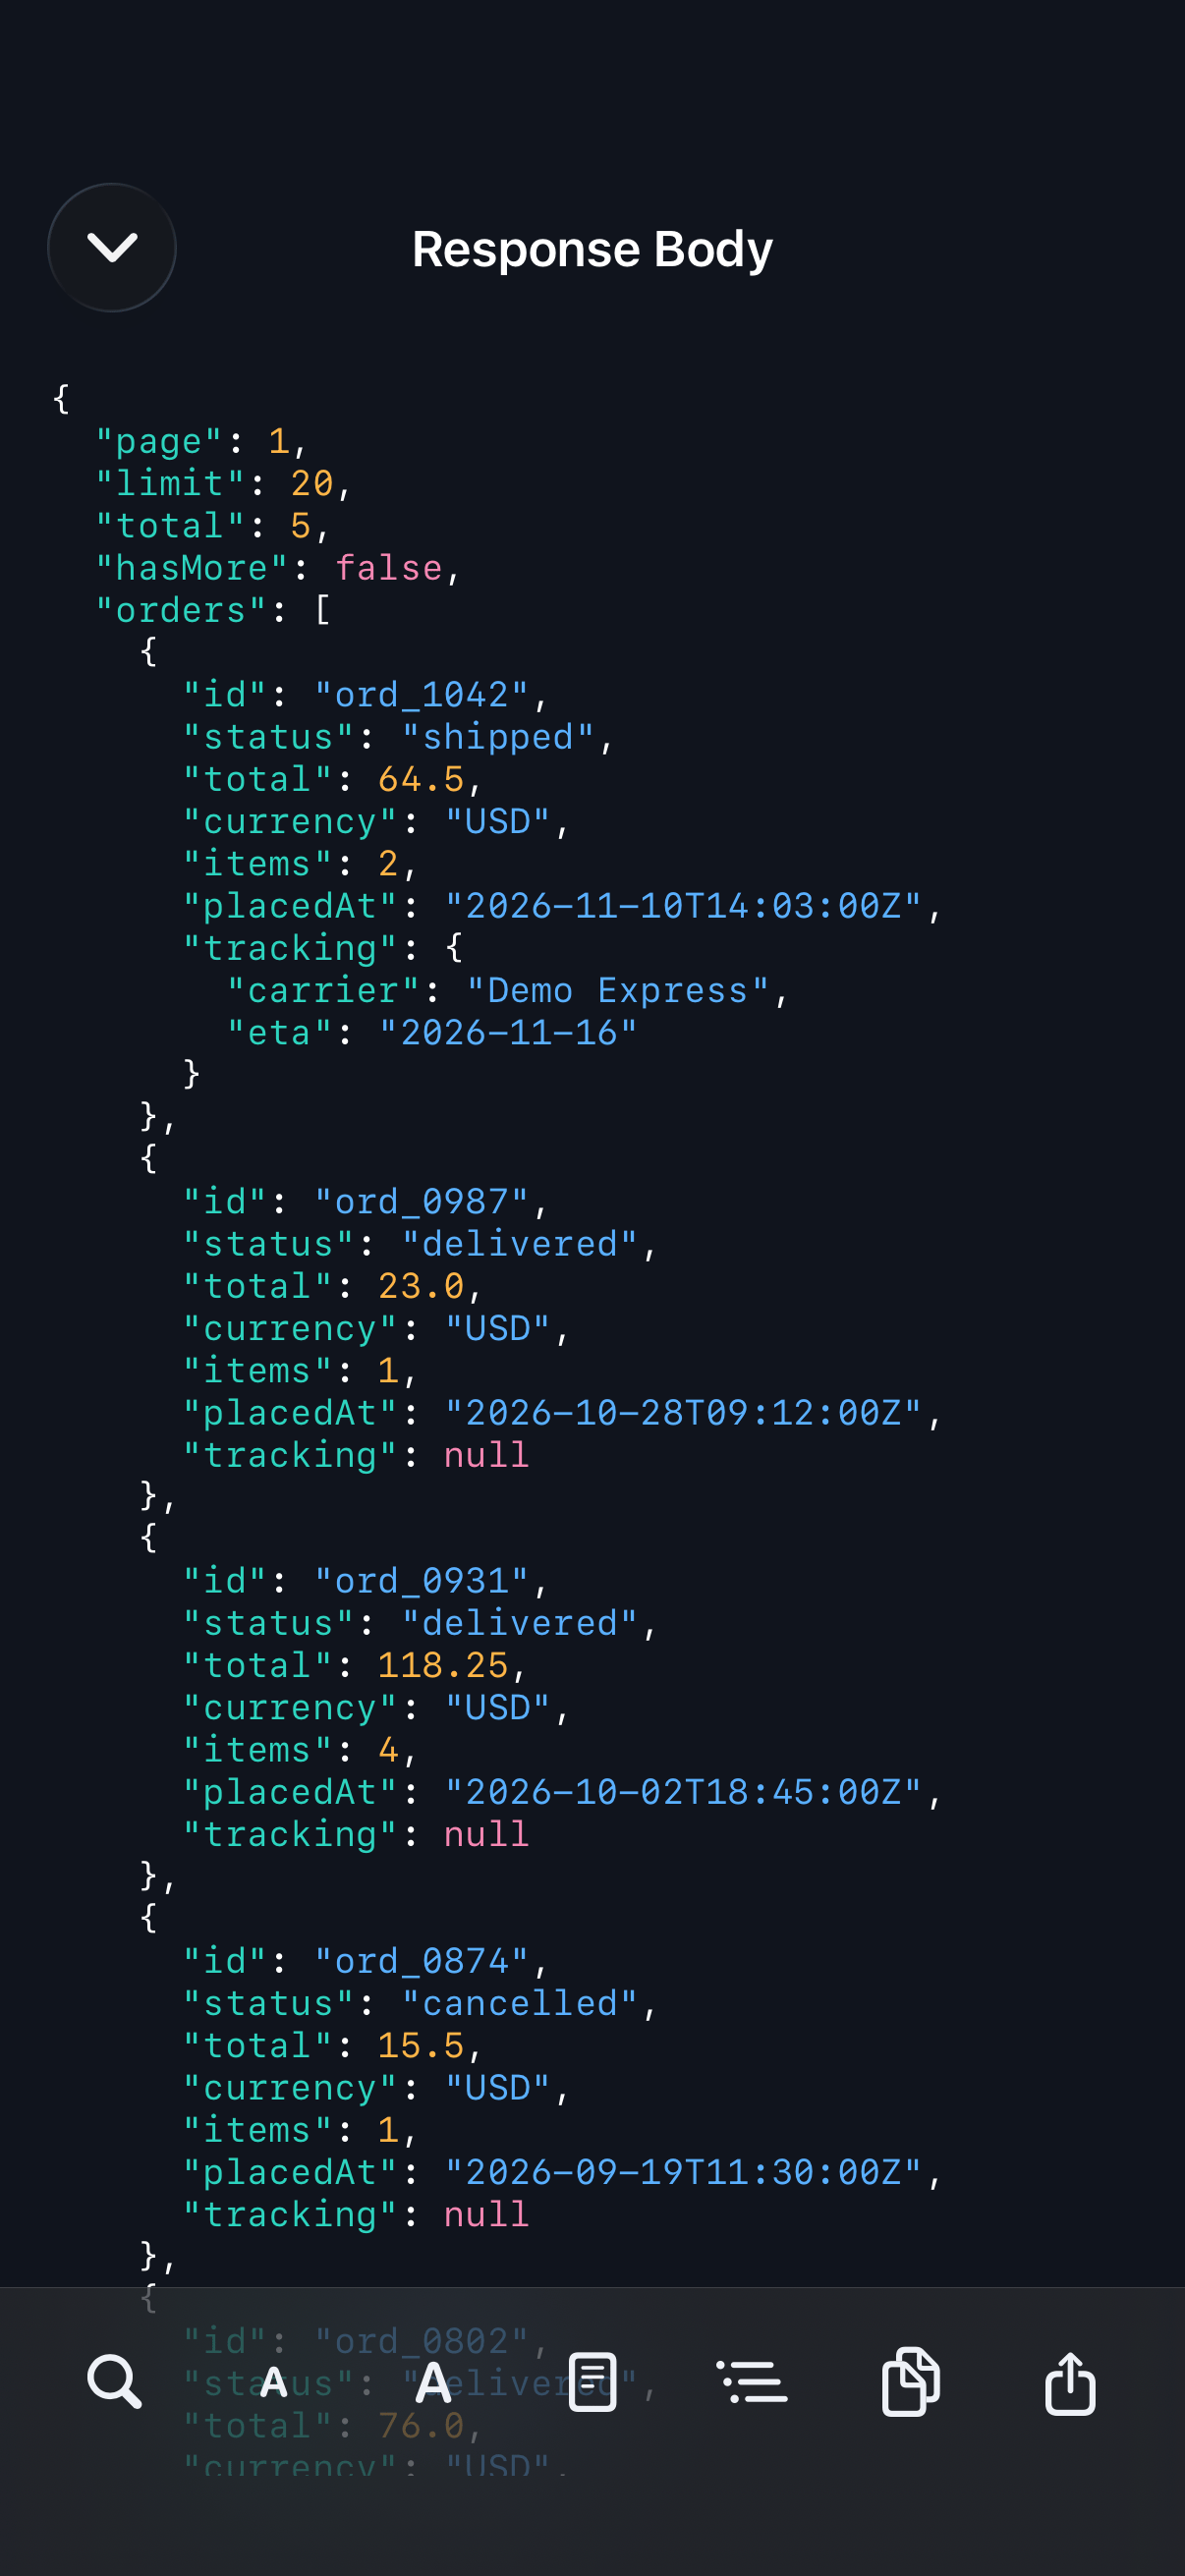
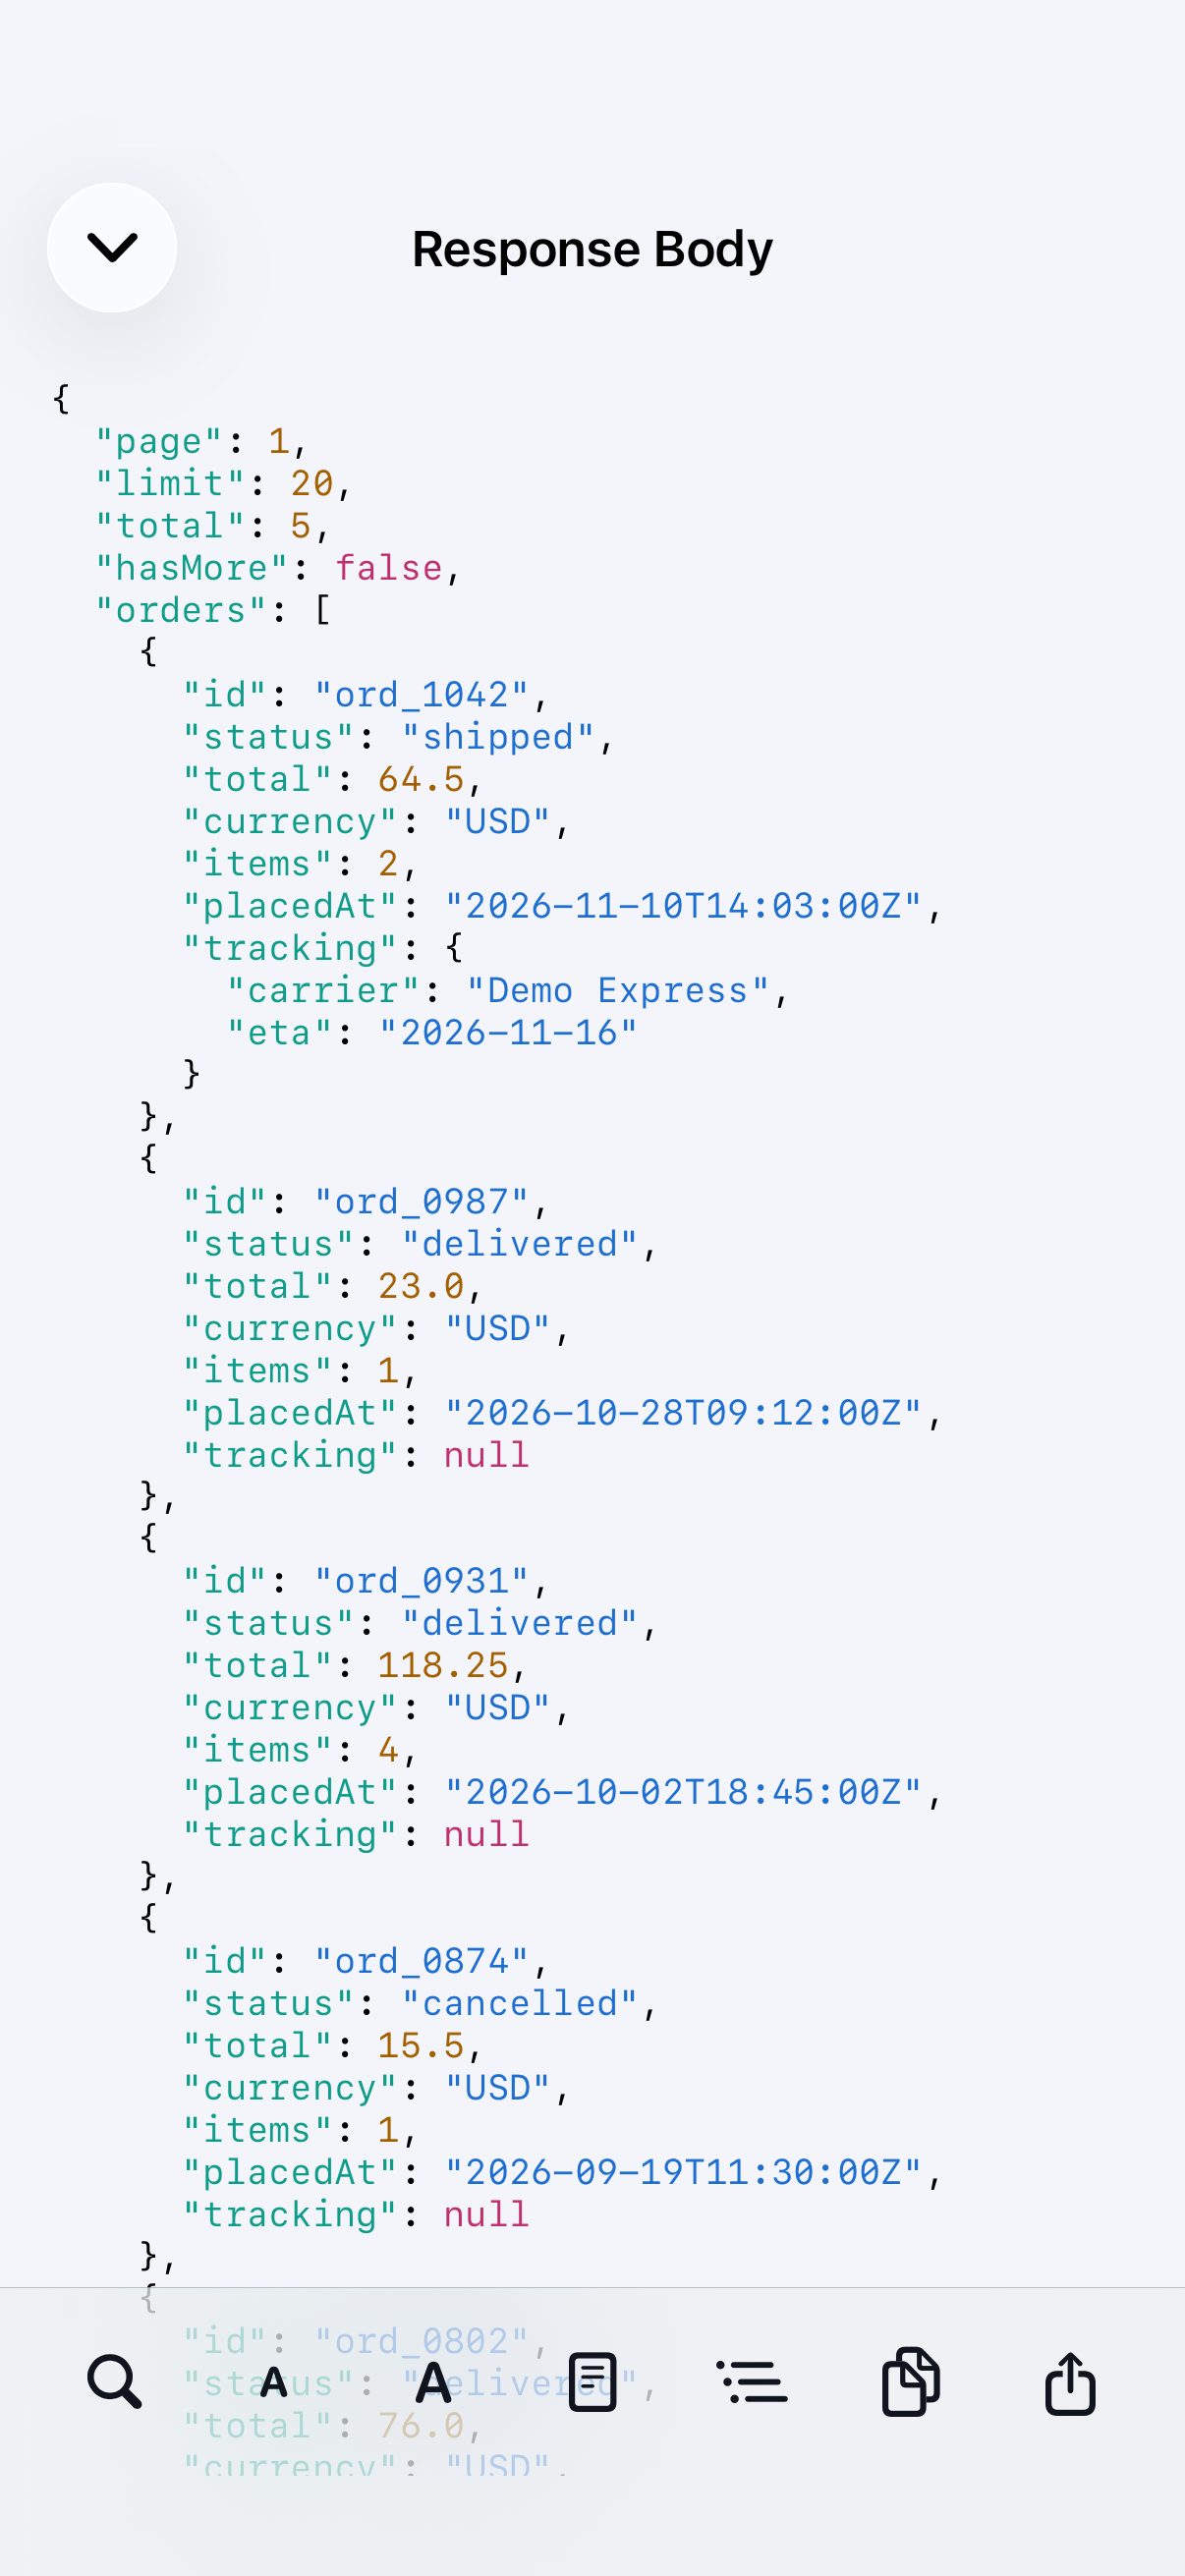
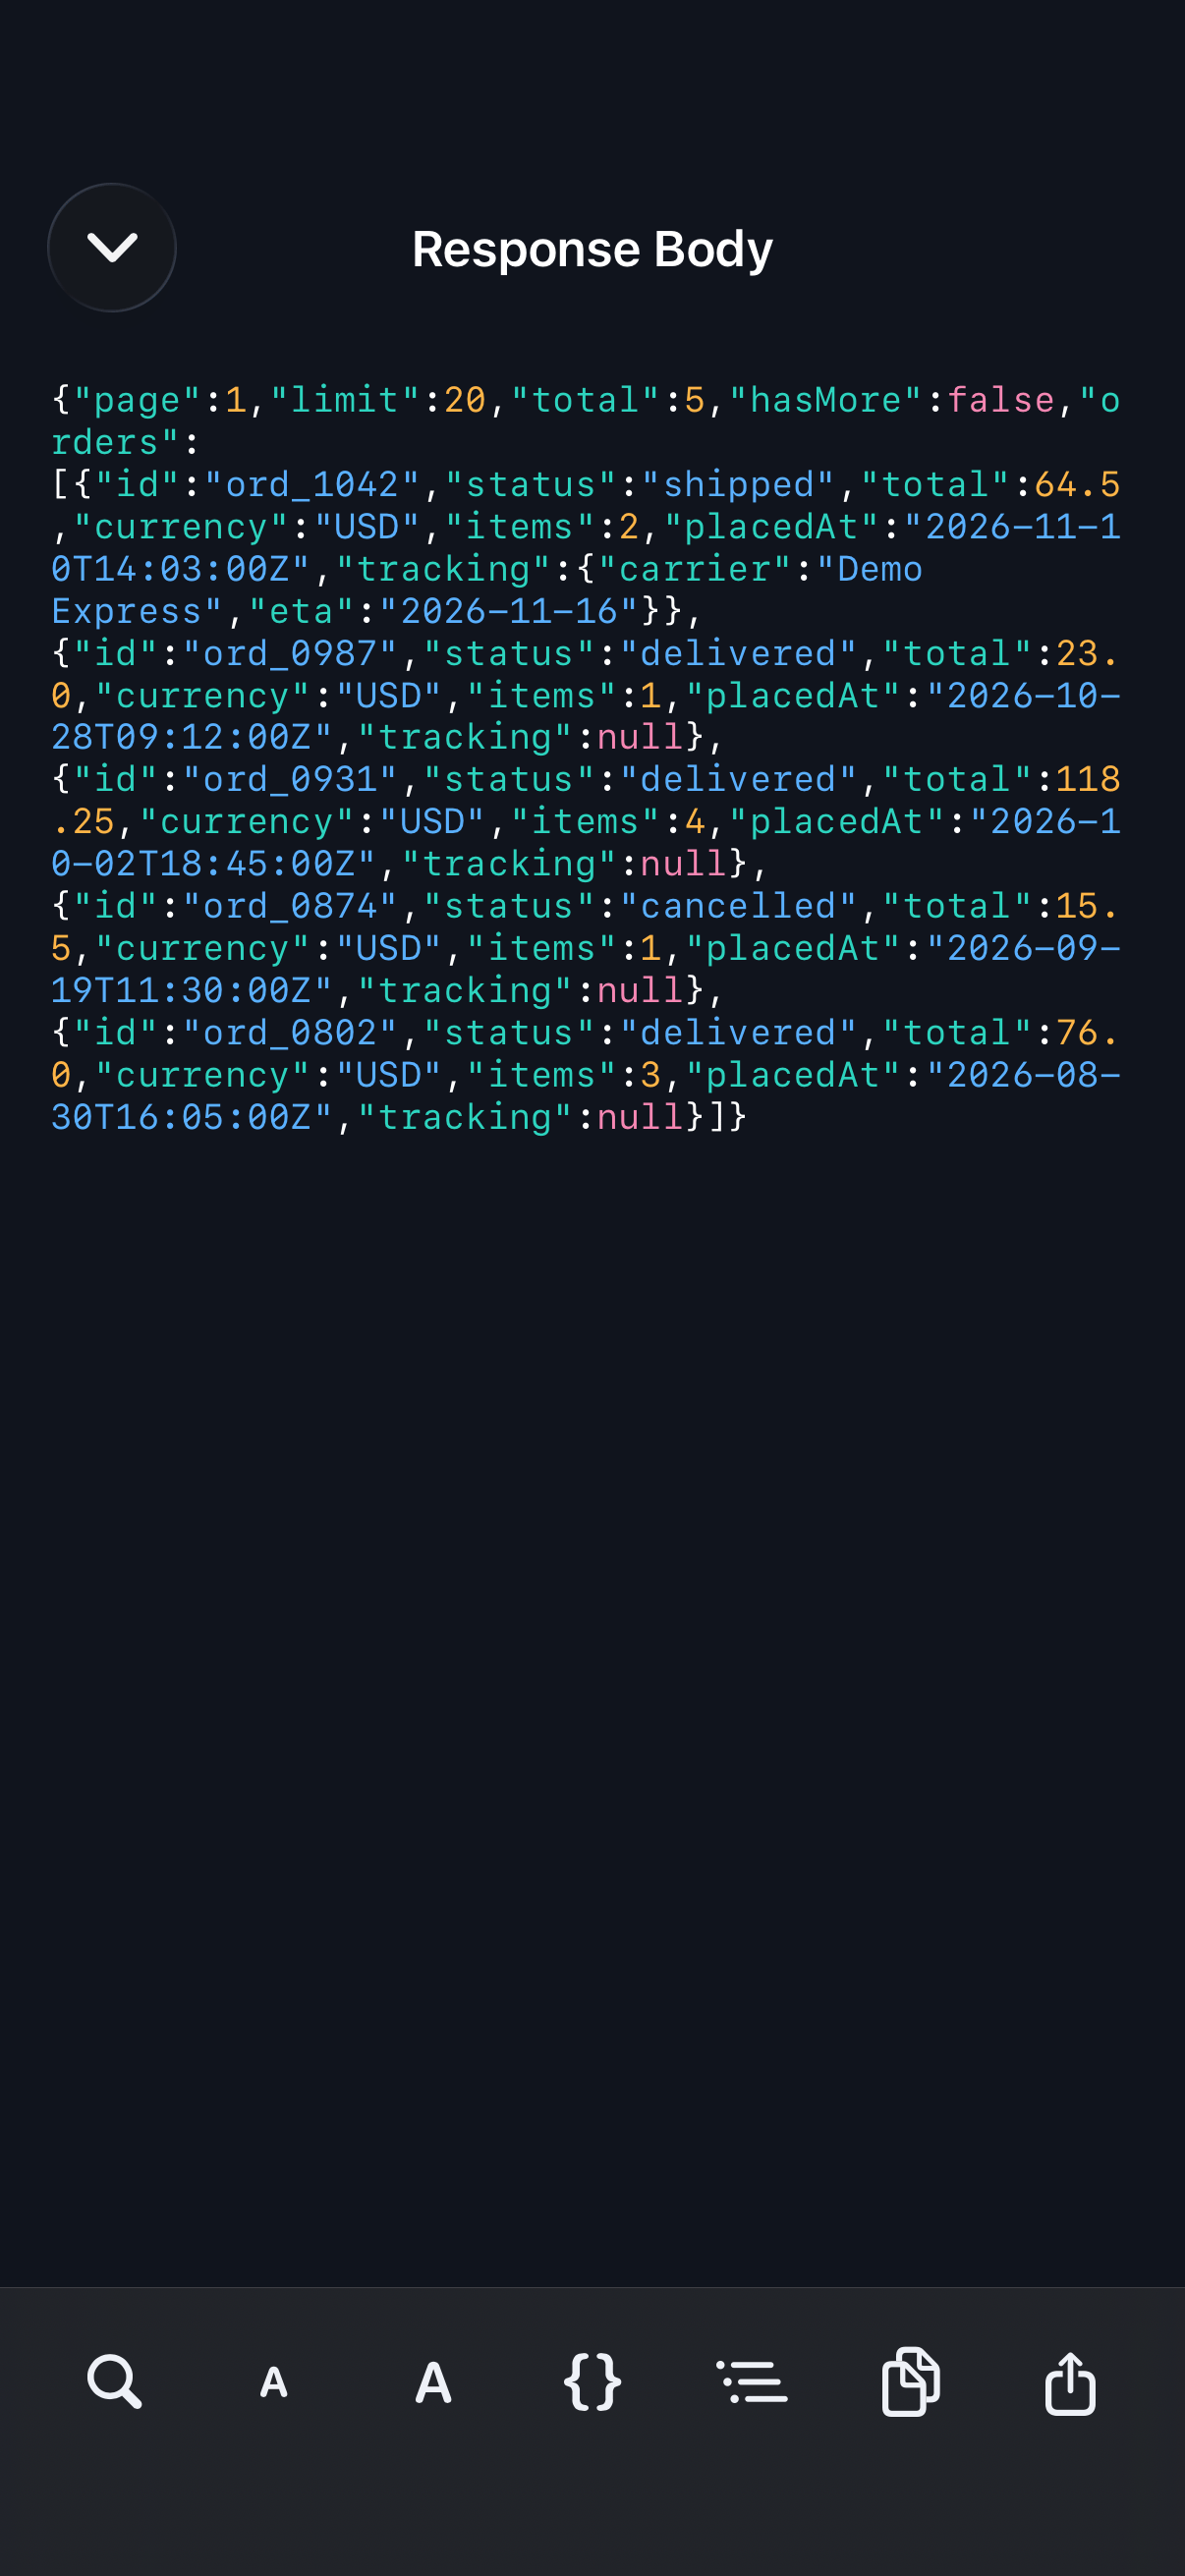
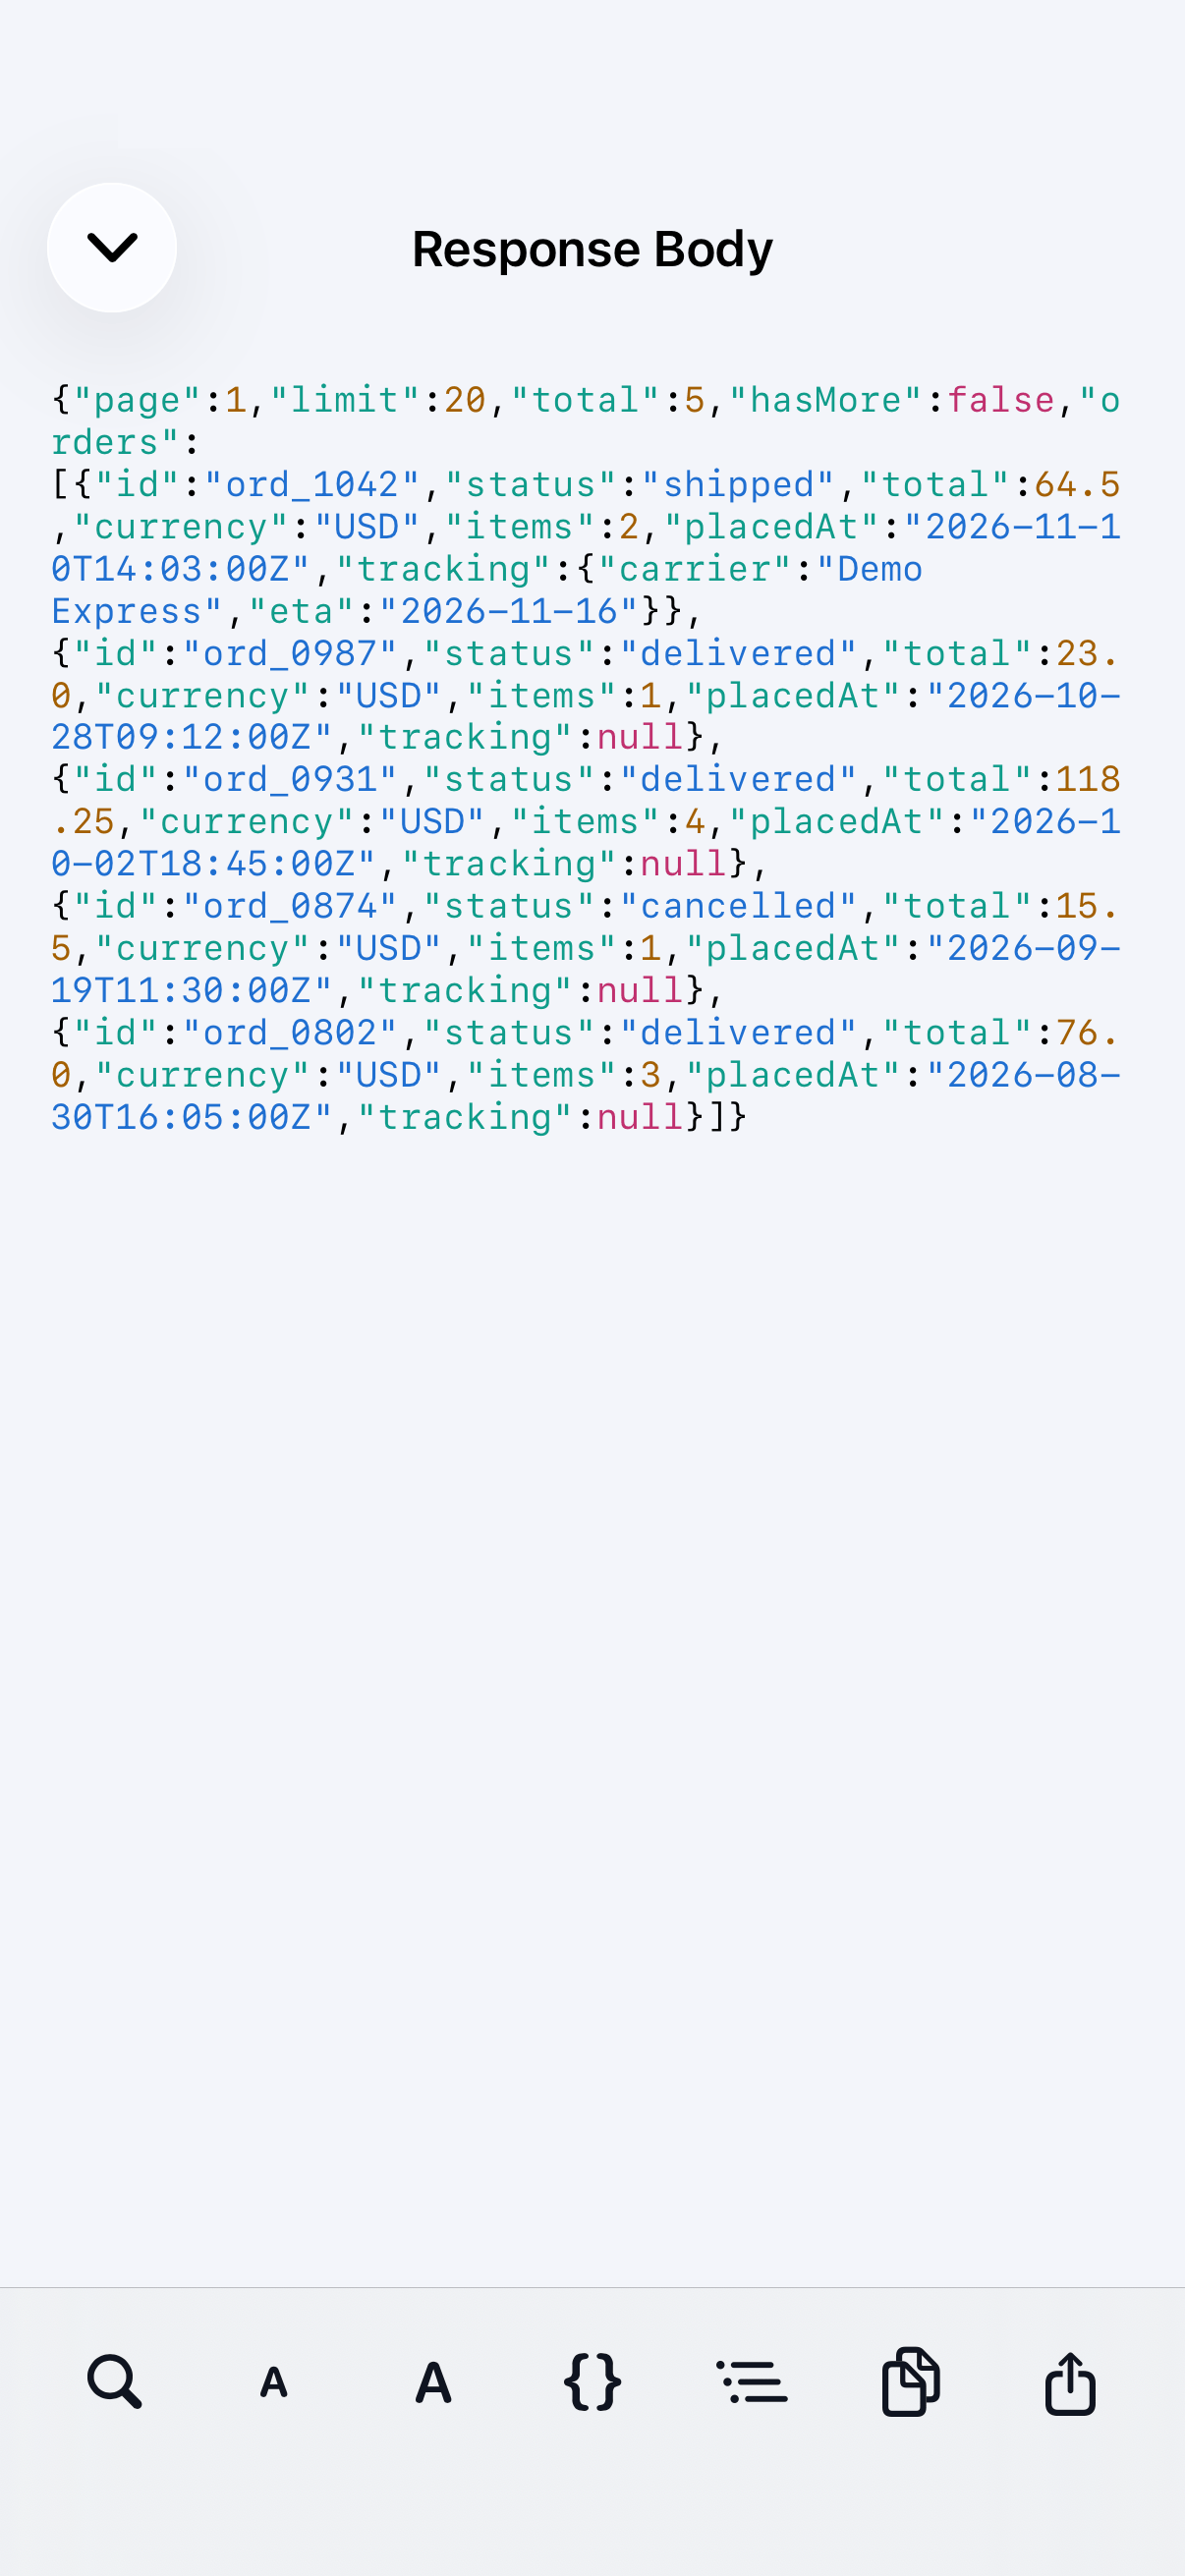
Open the full body
Tap View Full Body to read a long payload full-screen.
Step 07
Switch to plain text
Use the toggle to view the body exactly as received. This helps when a payload isn't valid JSON, or when exact whitespace matters.