Guide
Reading the traffic list
Group, search, filter and pin so the request you need is always easy to find.
With capture running, every request your app makes appears on the Traffic tab as it happens. These steps show how to arrange and narrow the list so the call you care about is easy to find.
Step 01
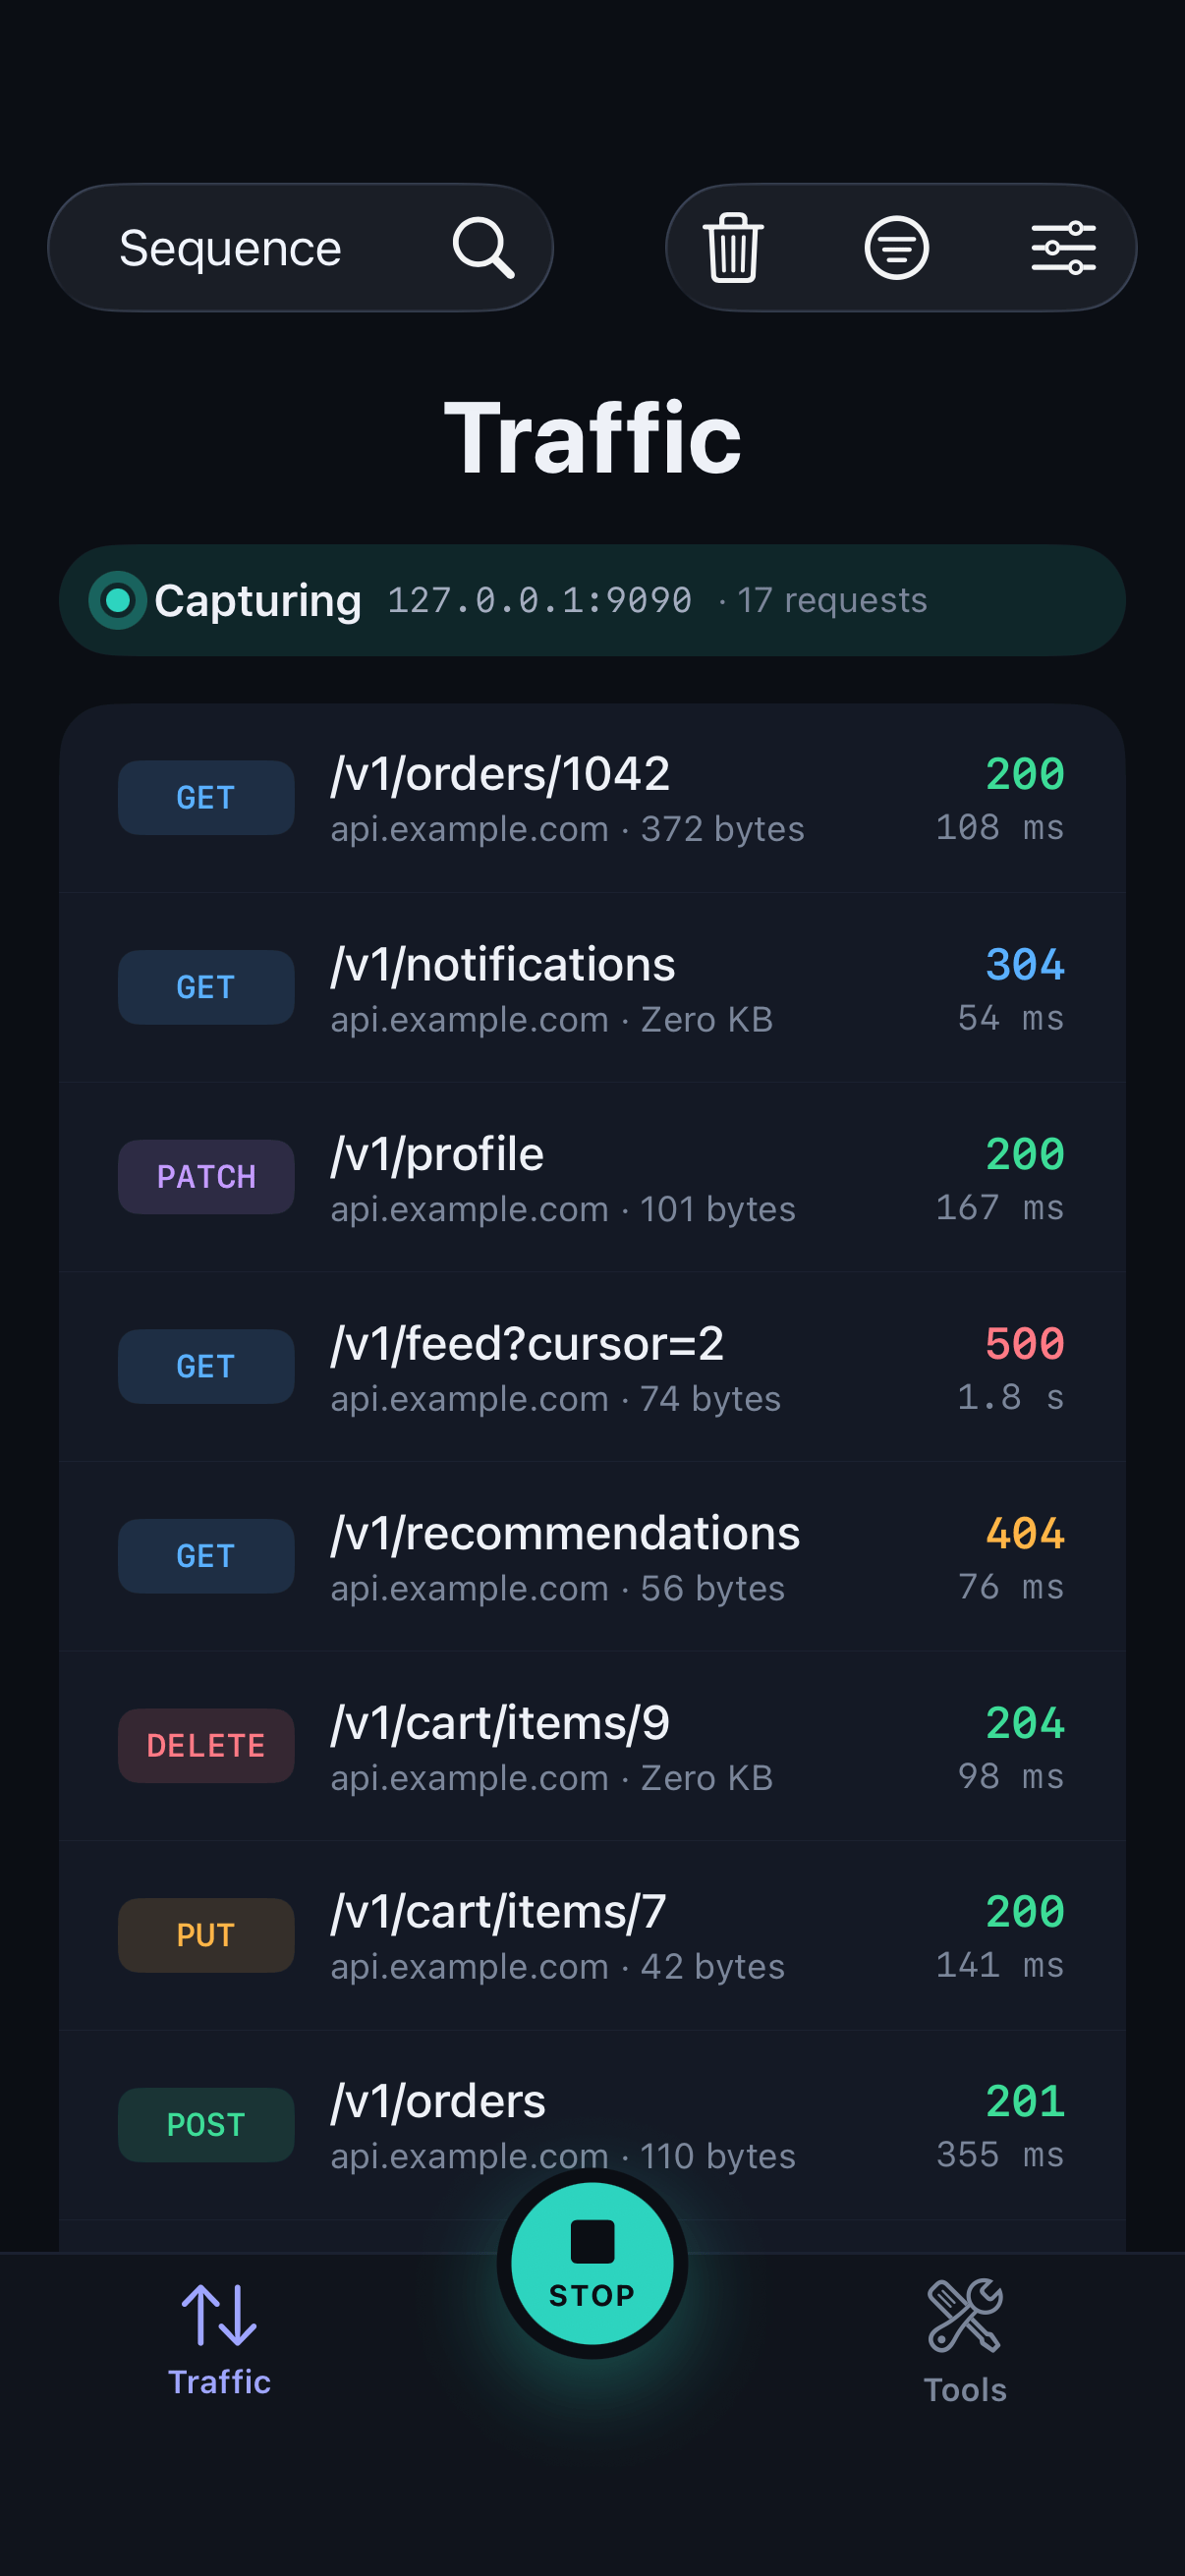
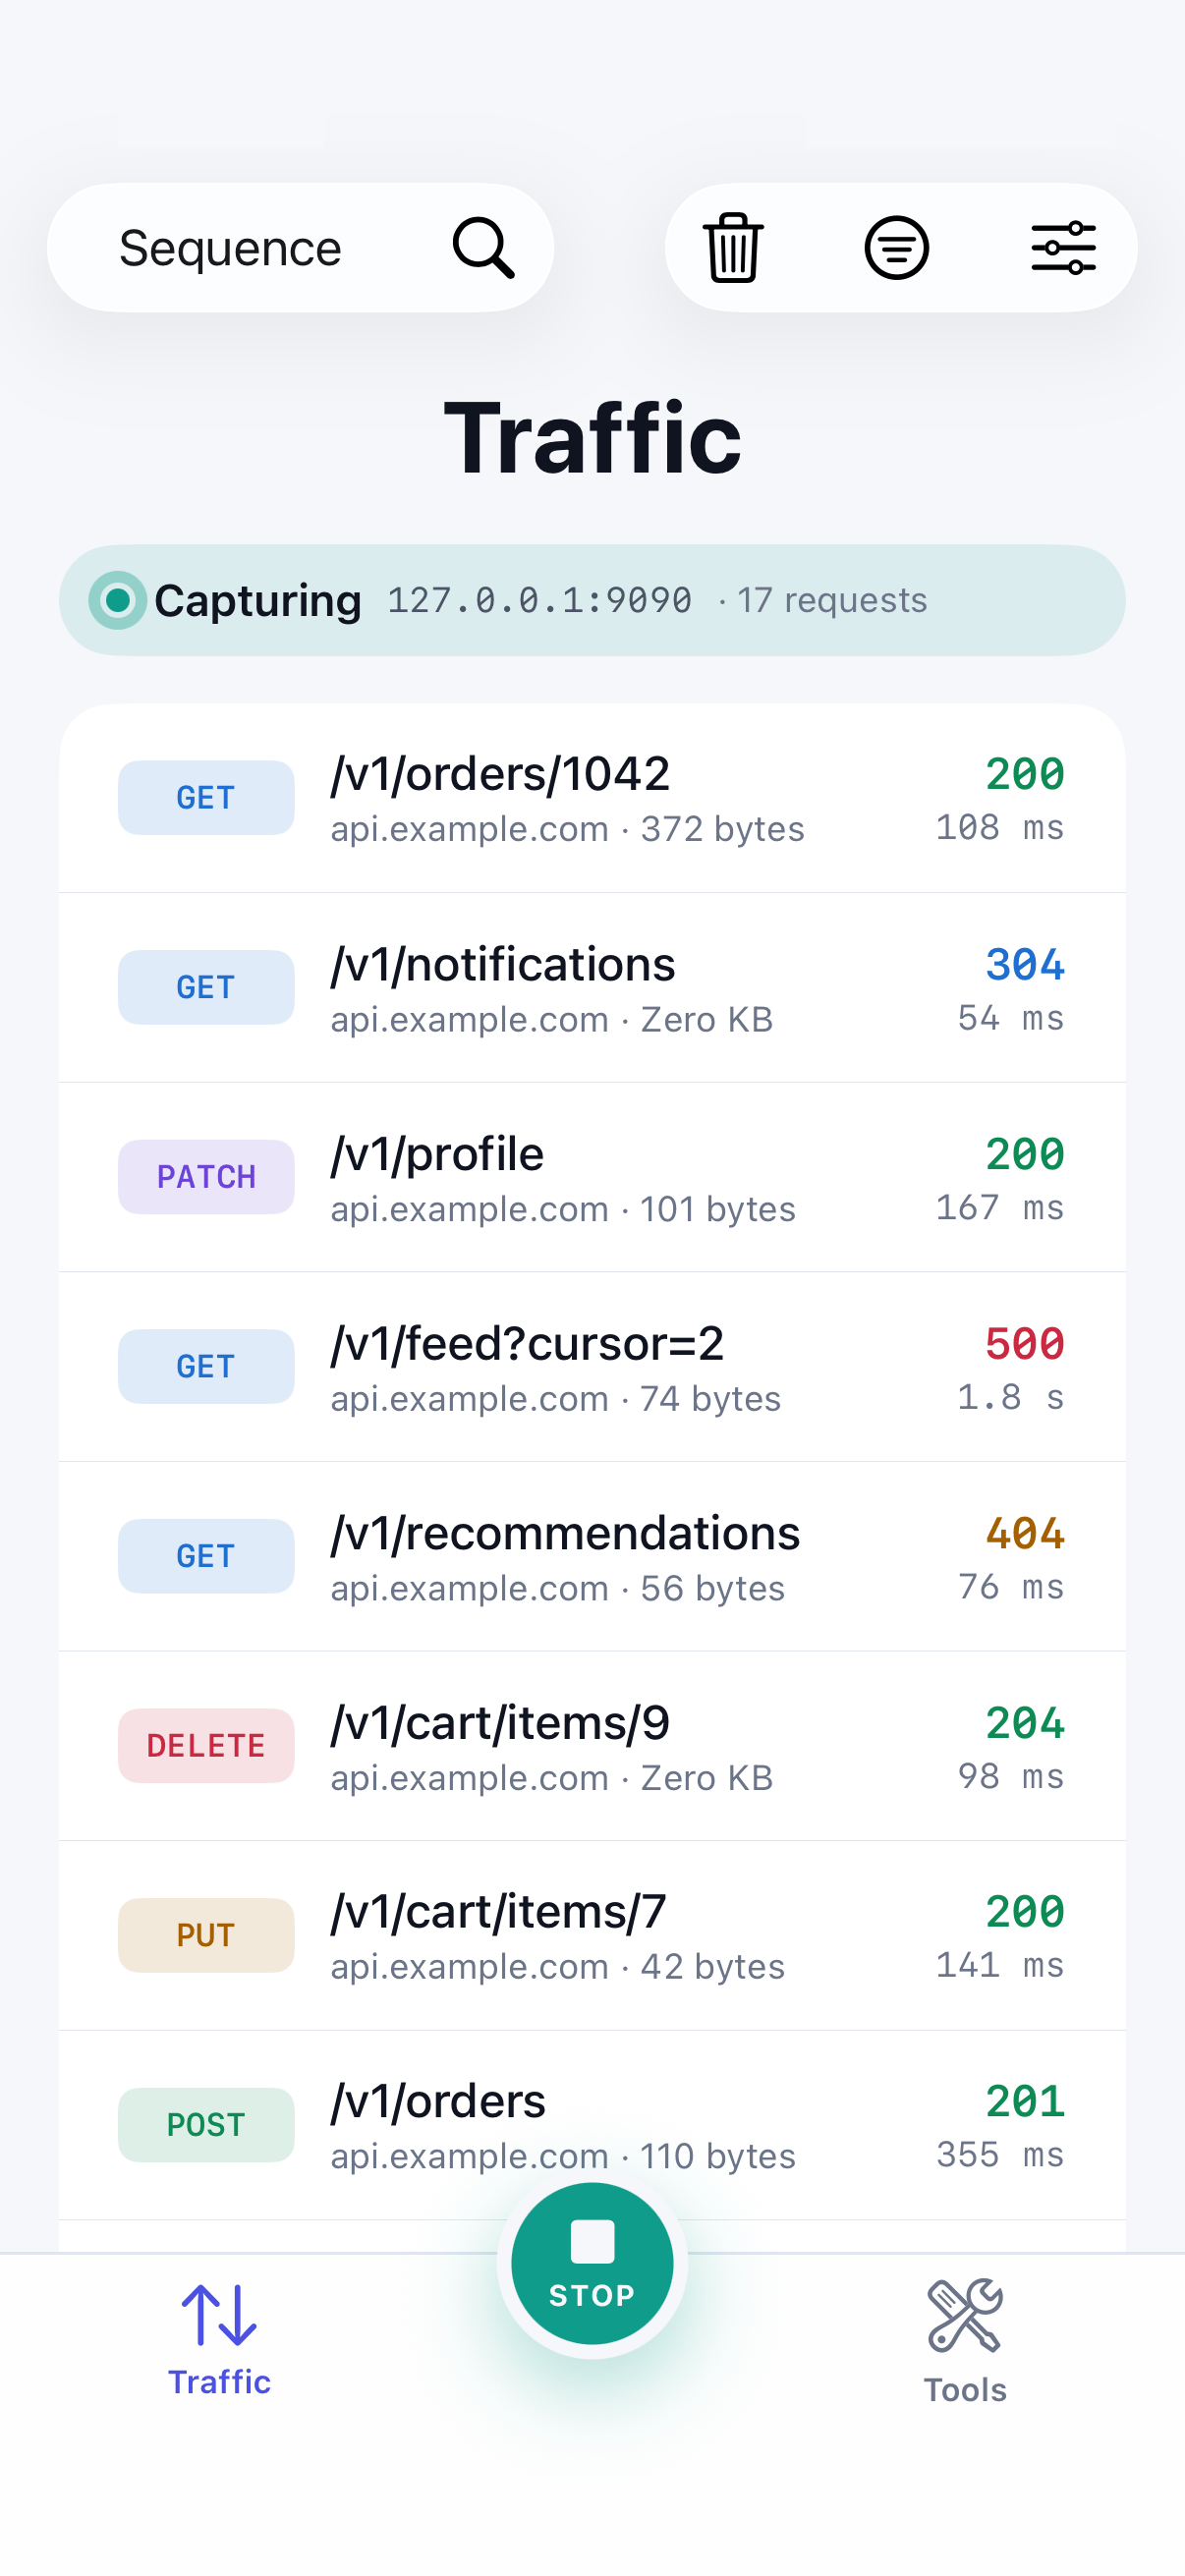
Start with the sequence view
By default, requests are listed in the order your app made them. Use this view to follow a flow from start to finish, such as sign-in or checkout.
Step 02
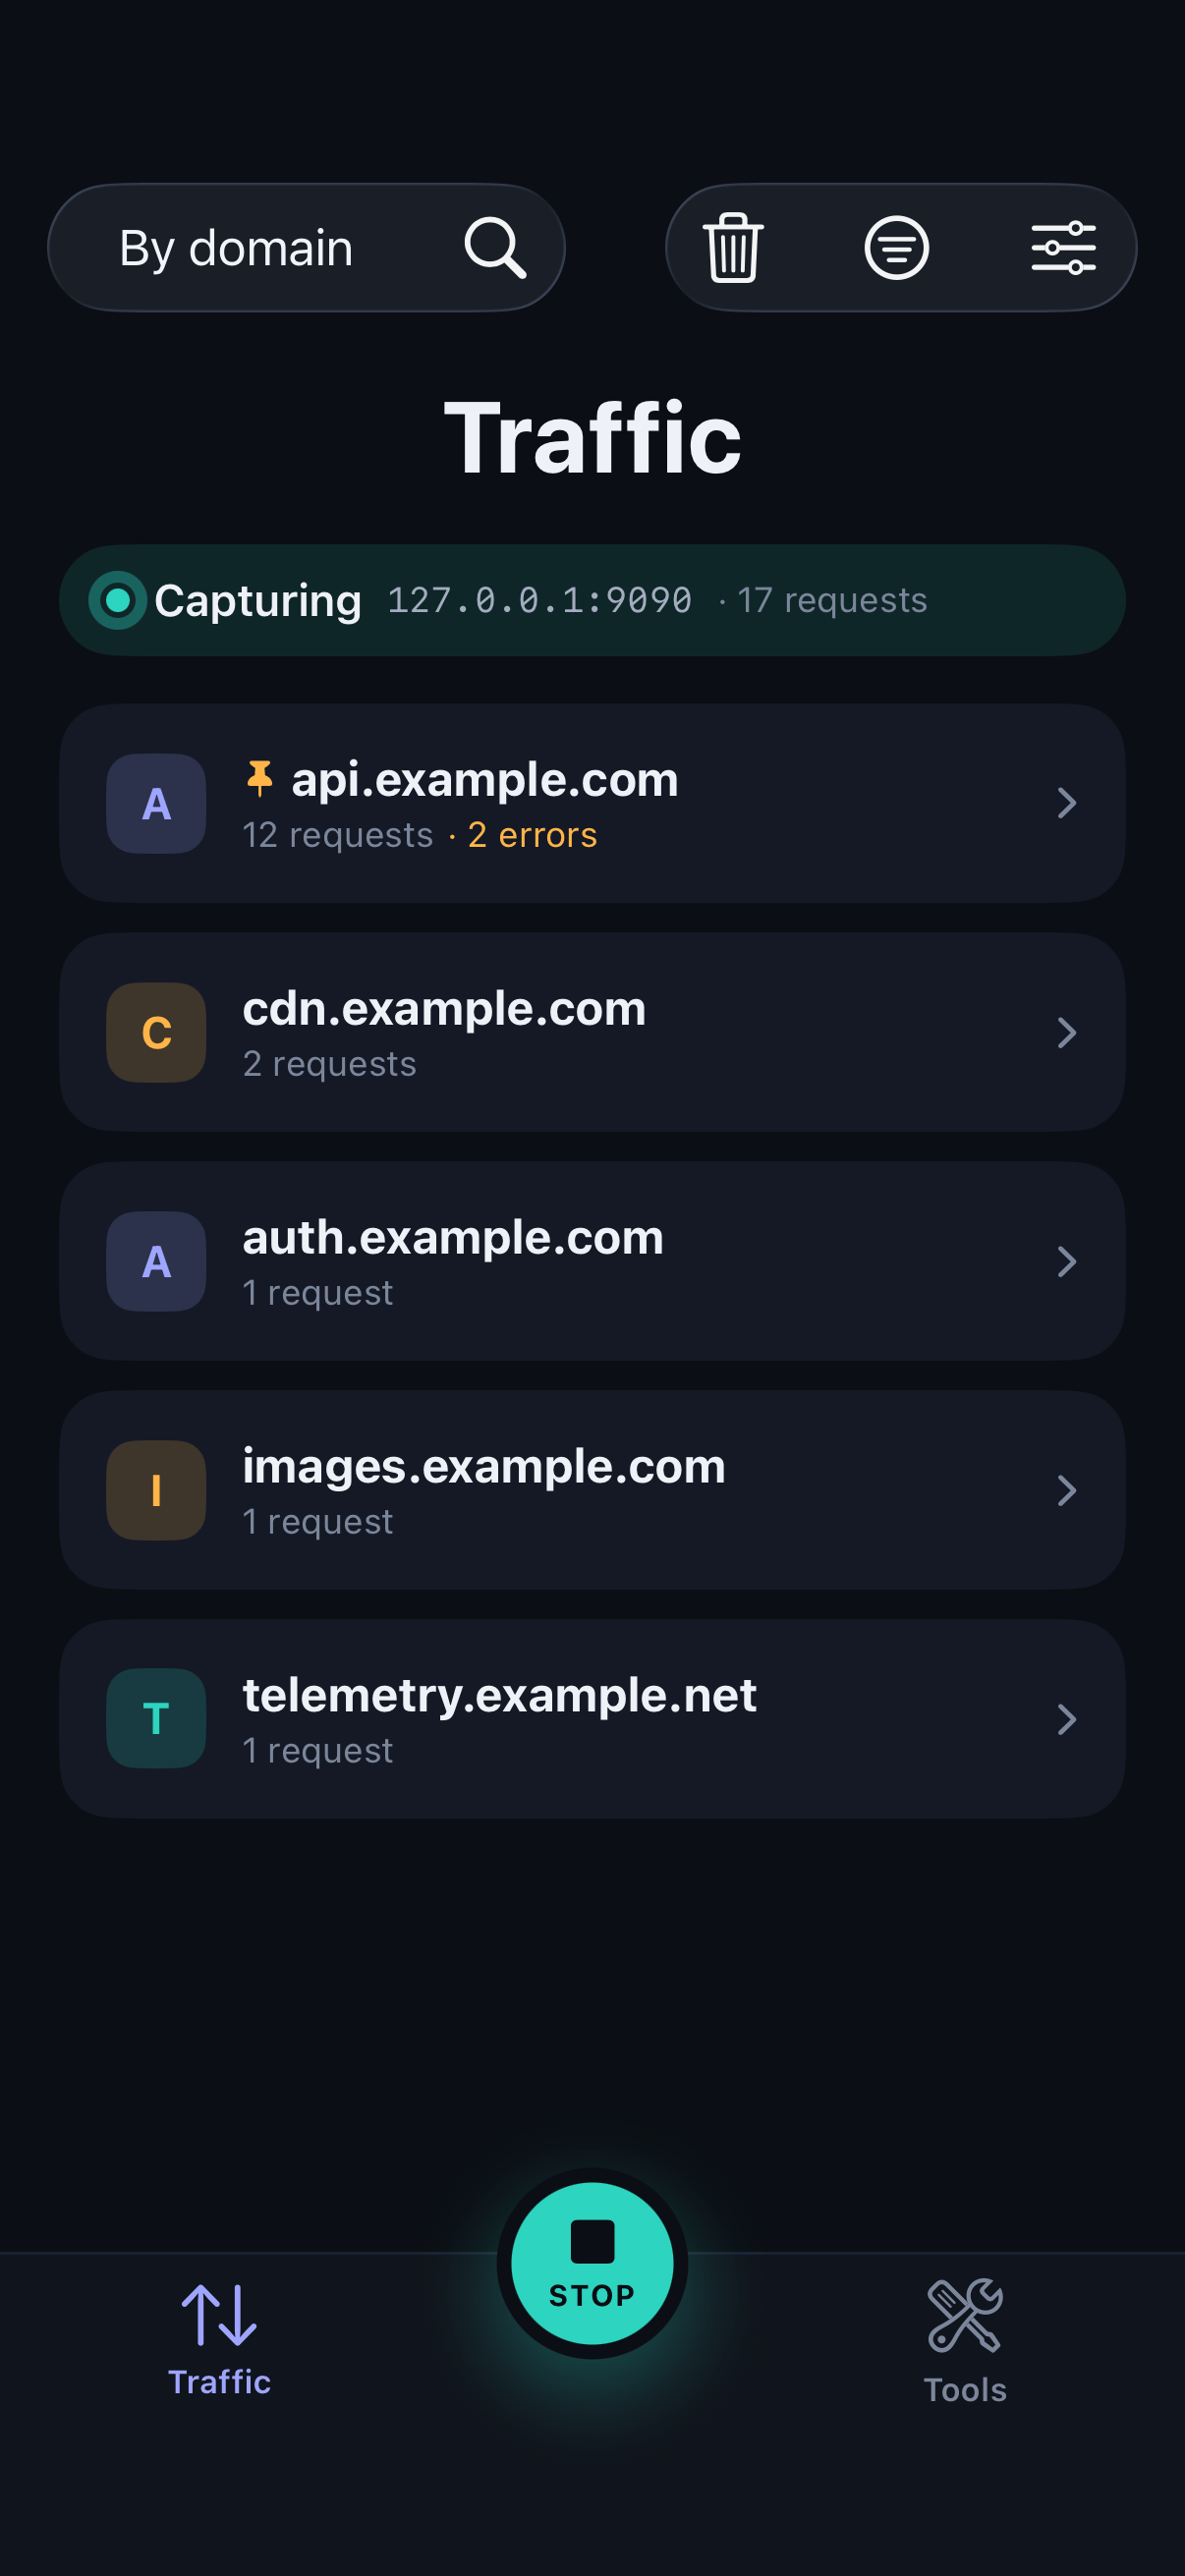
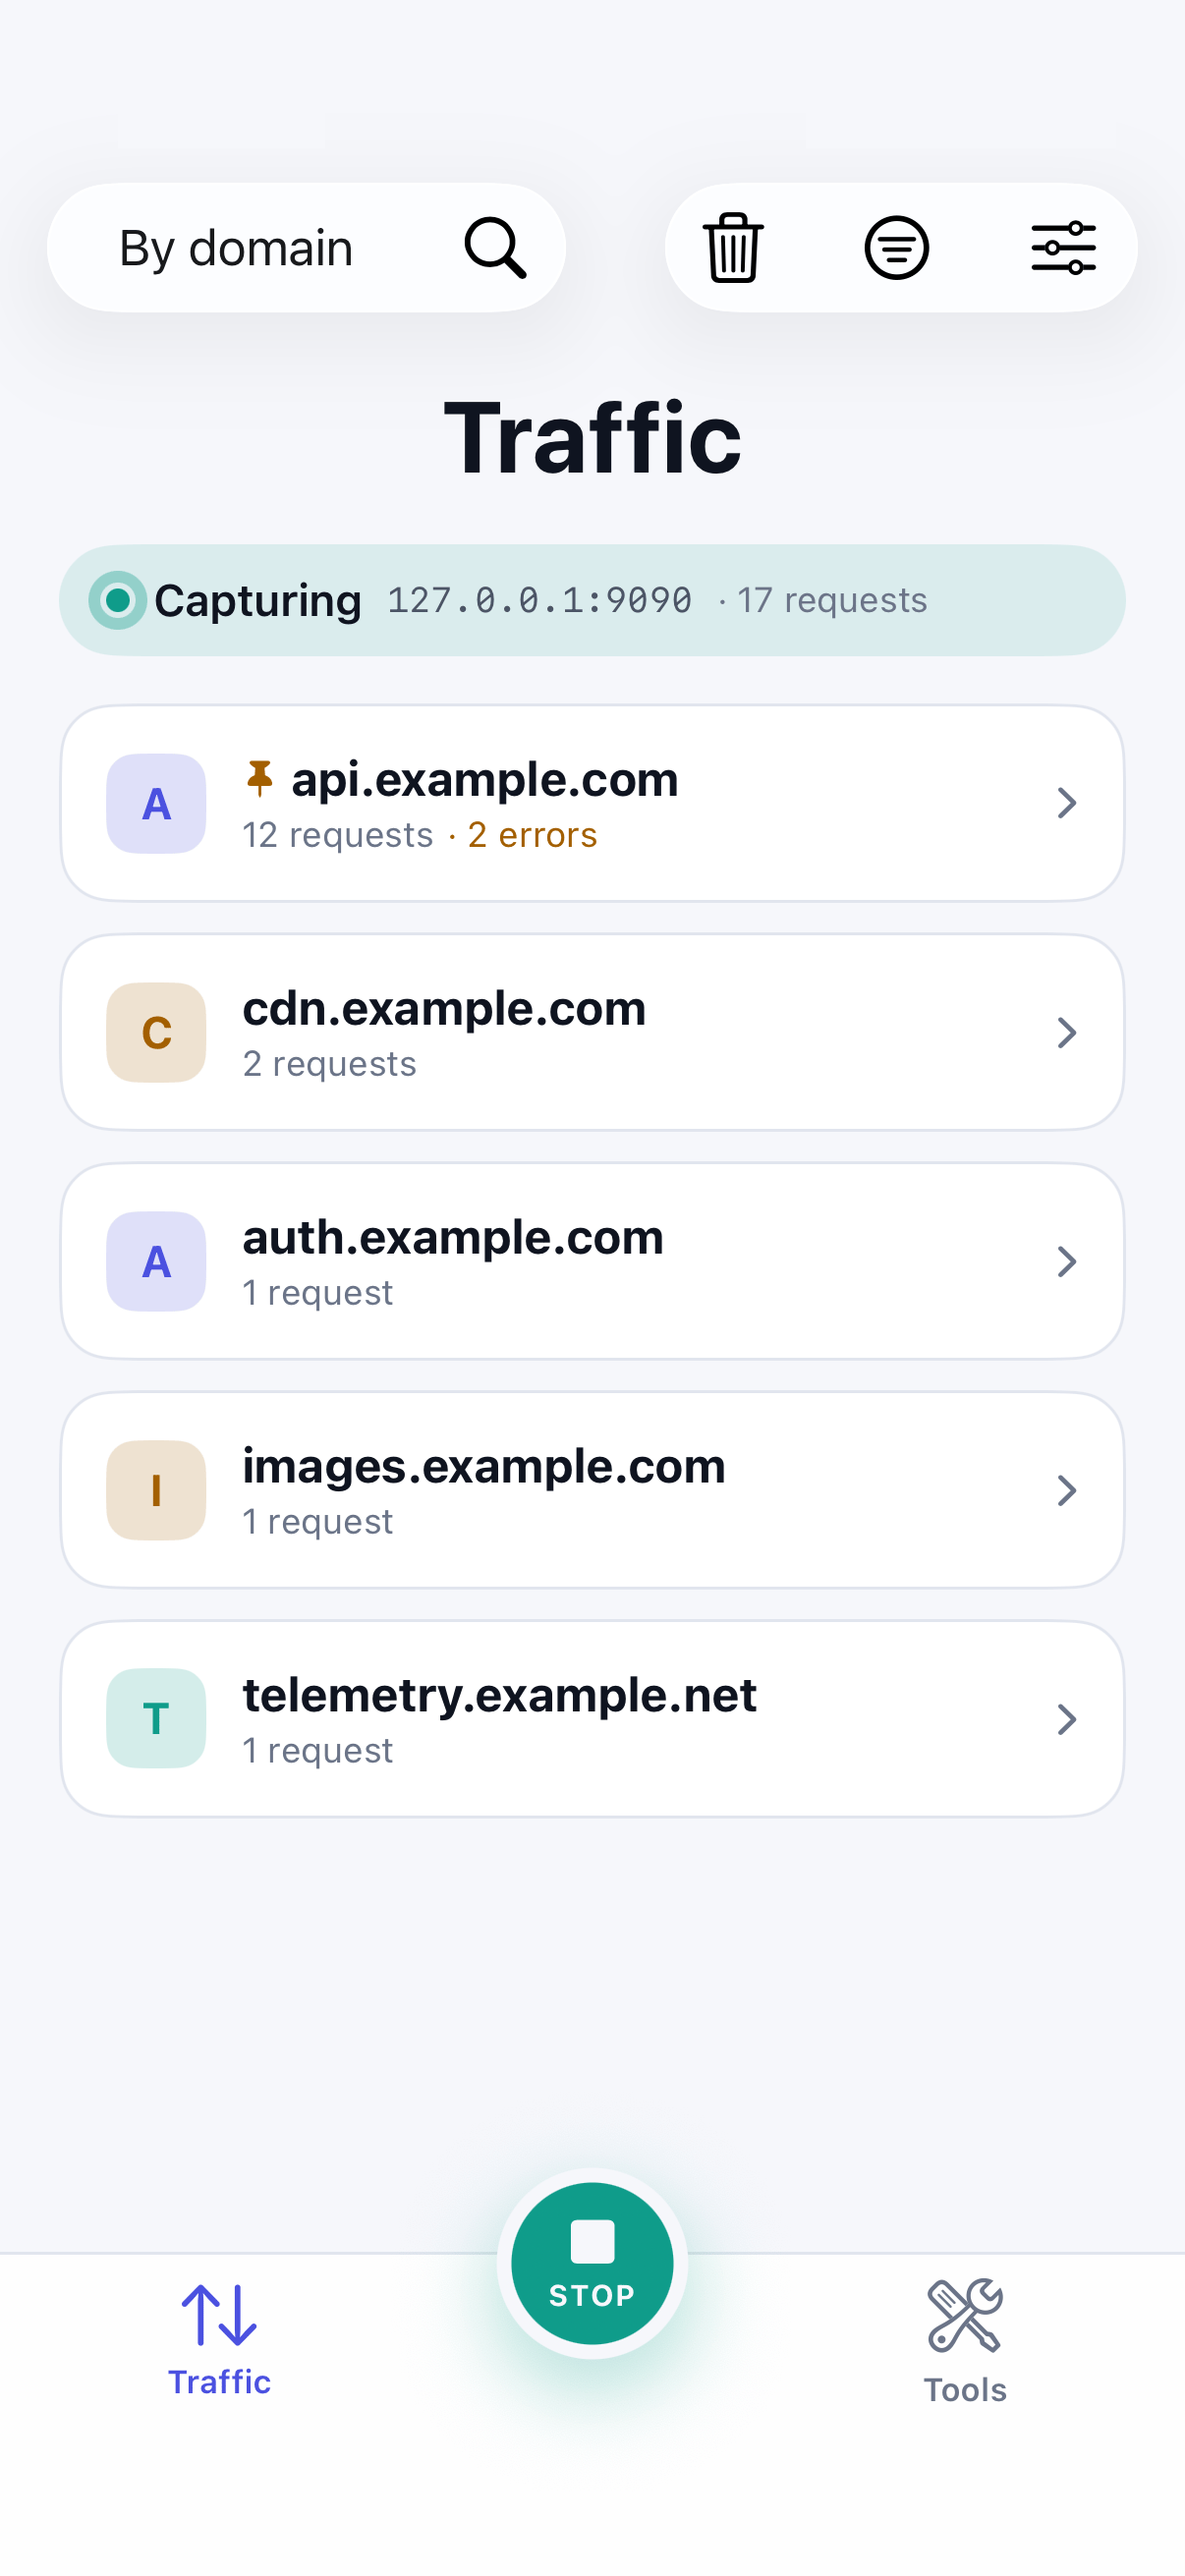
Group by domain
Tap the grouping menu at the top left and choose By domain. Each host gets its own card, which makes an unexpected call to an unfamiliar server easy to spot.
Step 03
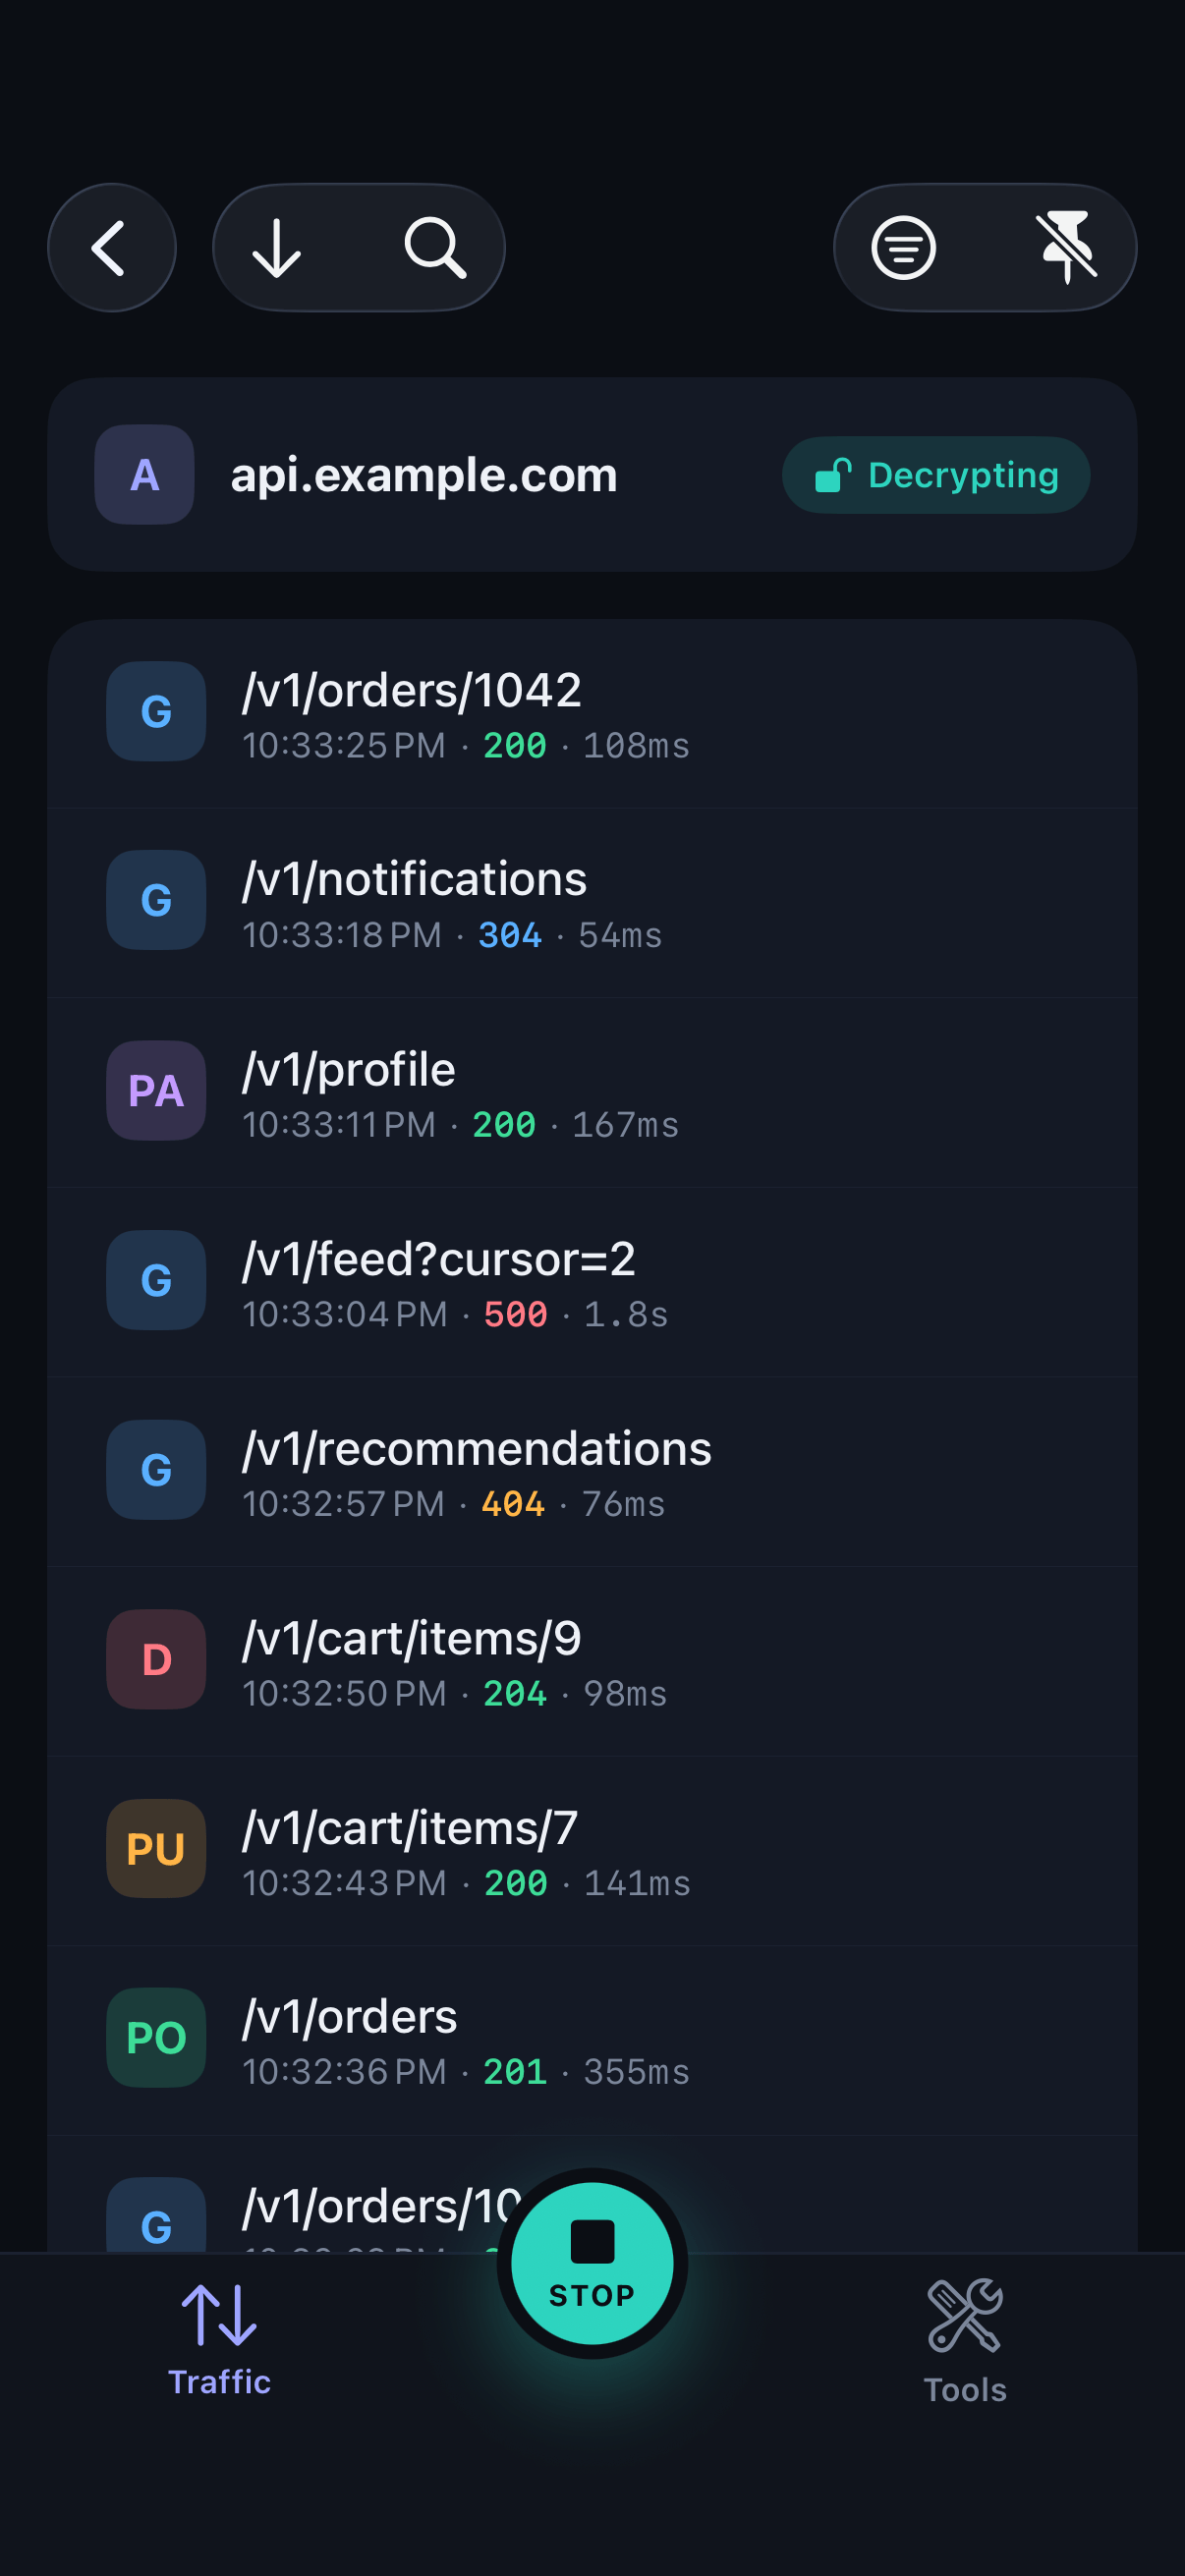
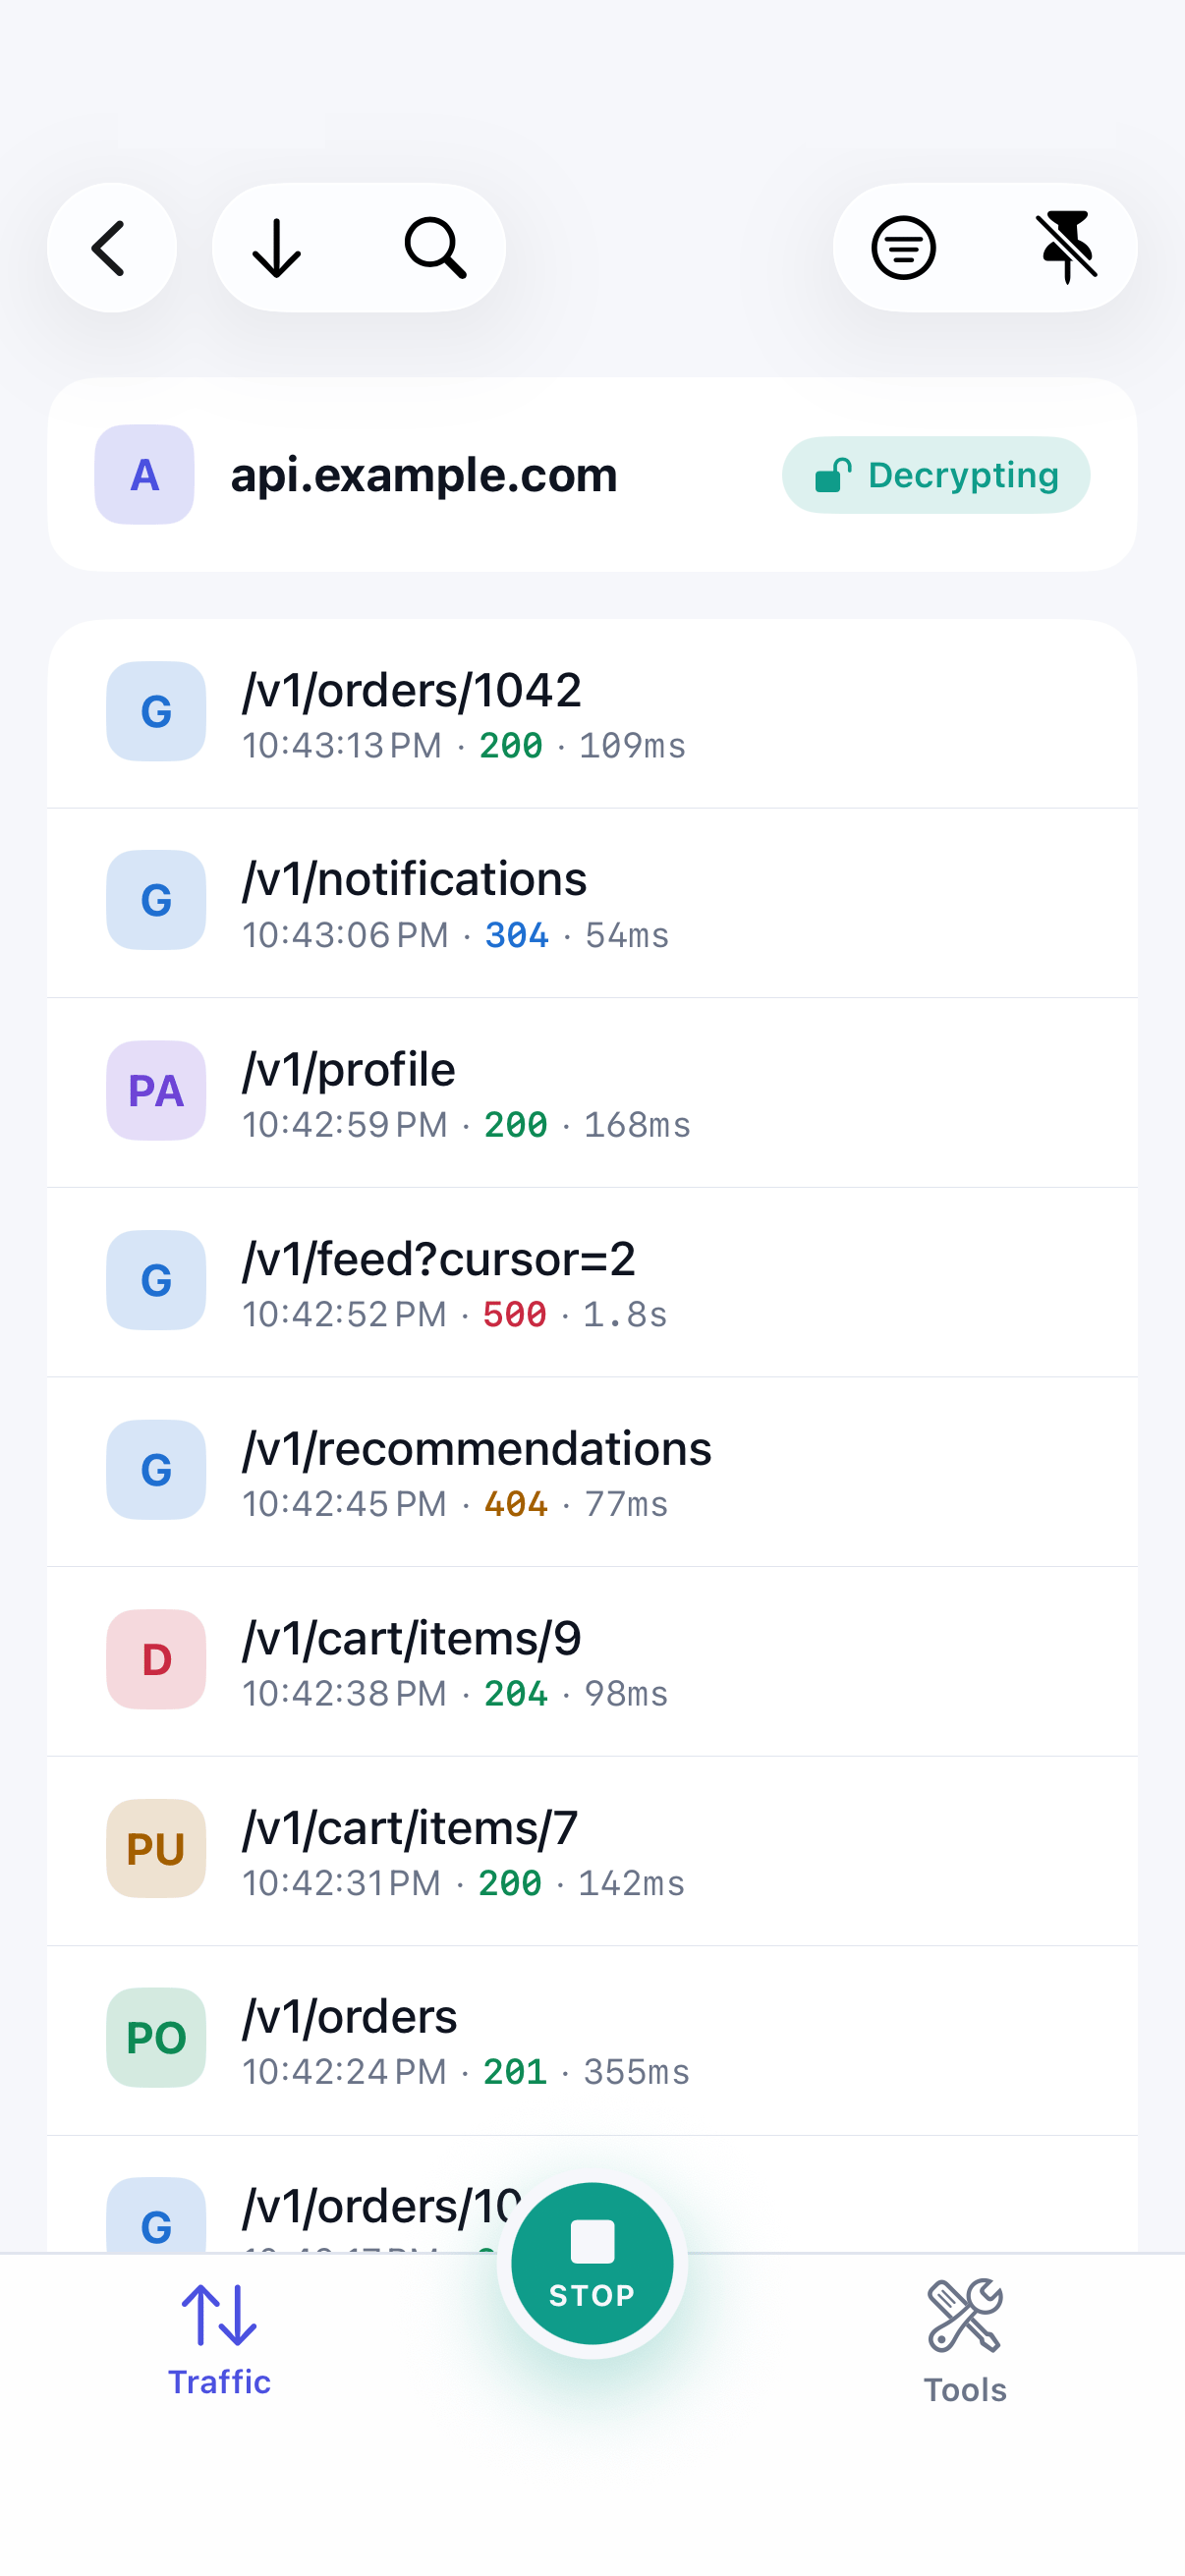
Open one domain
Tap a domain card to see only that host's requests.
Step 04
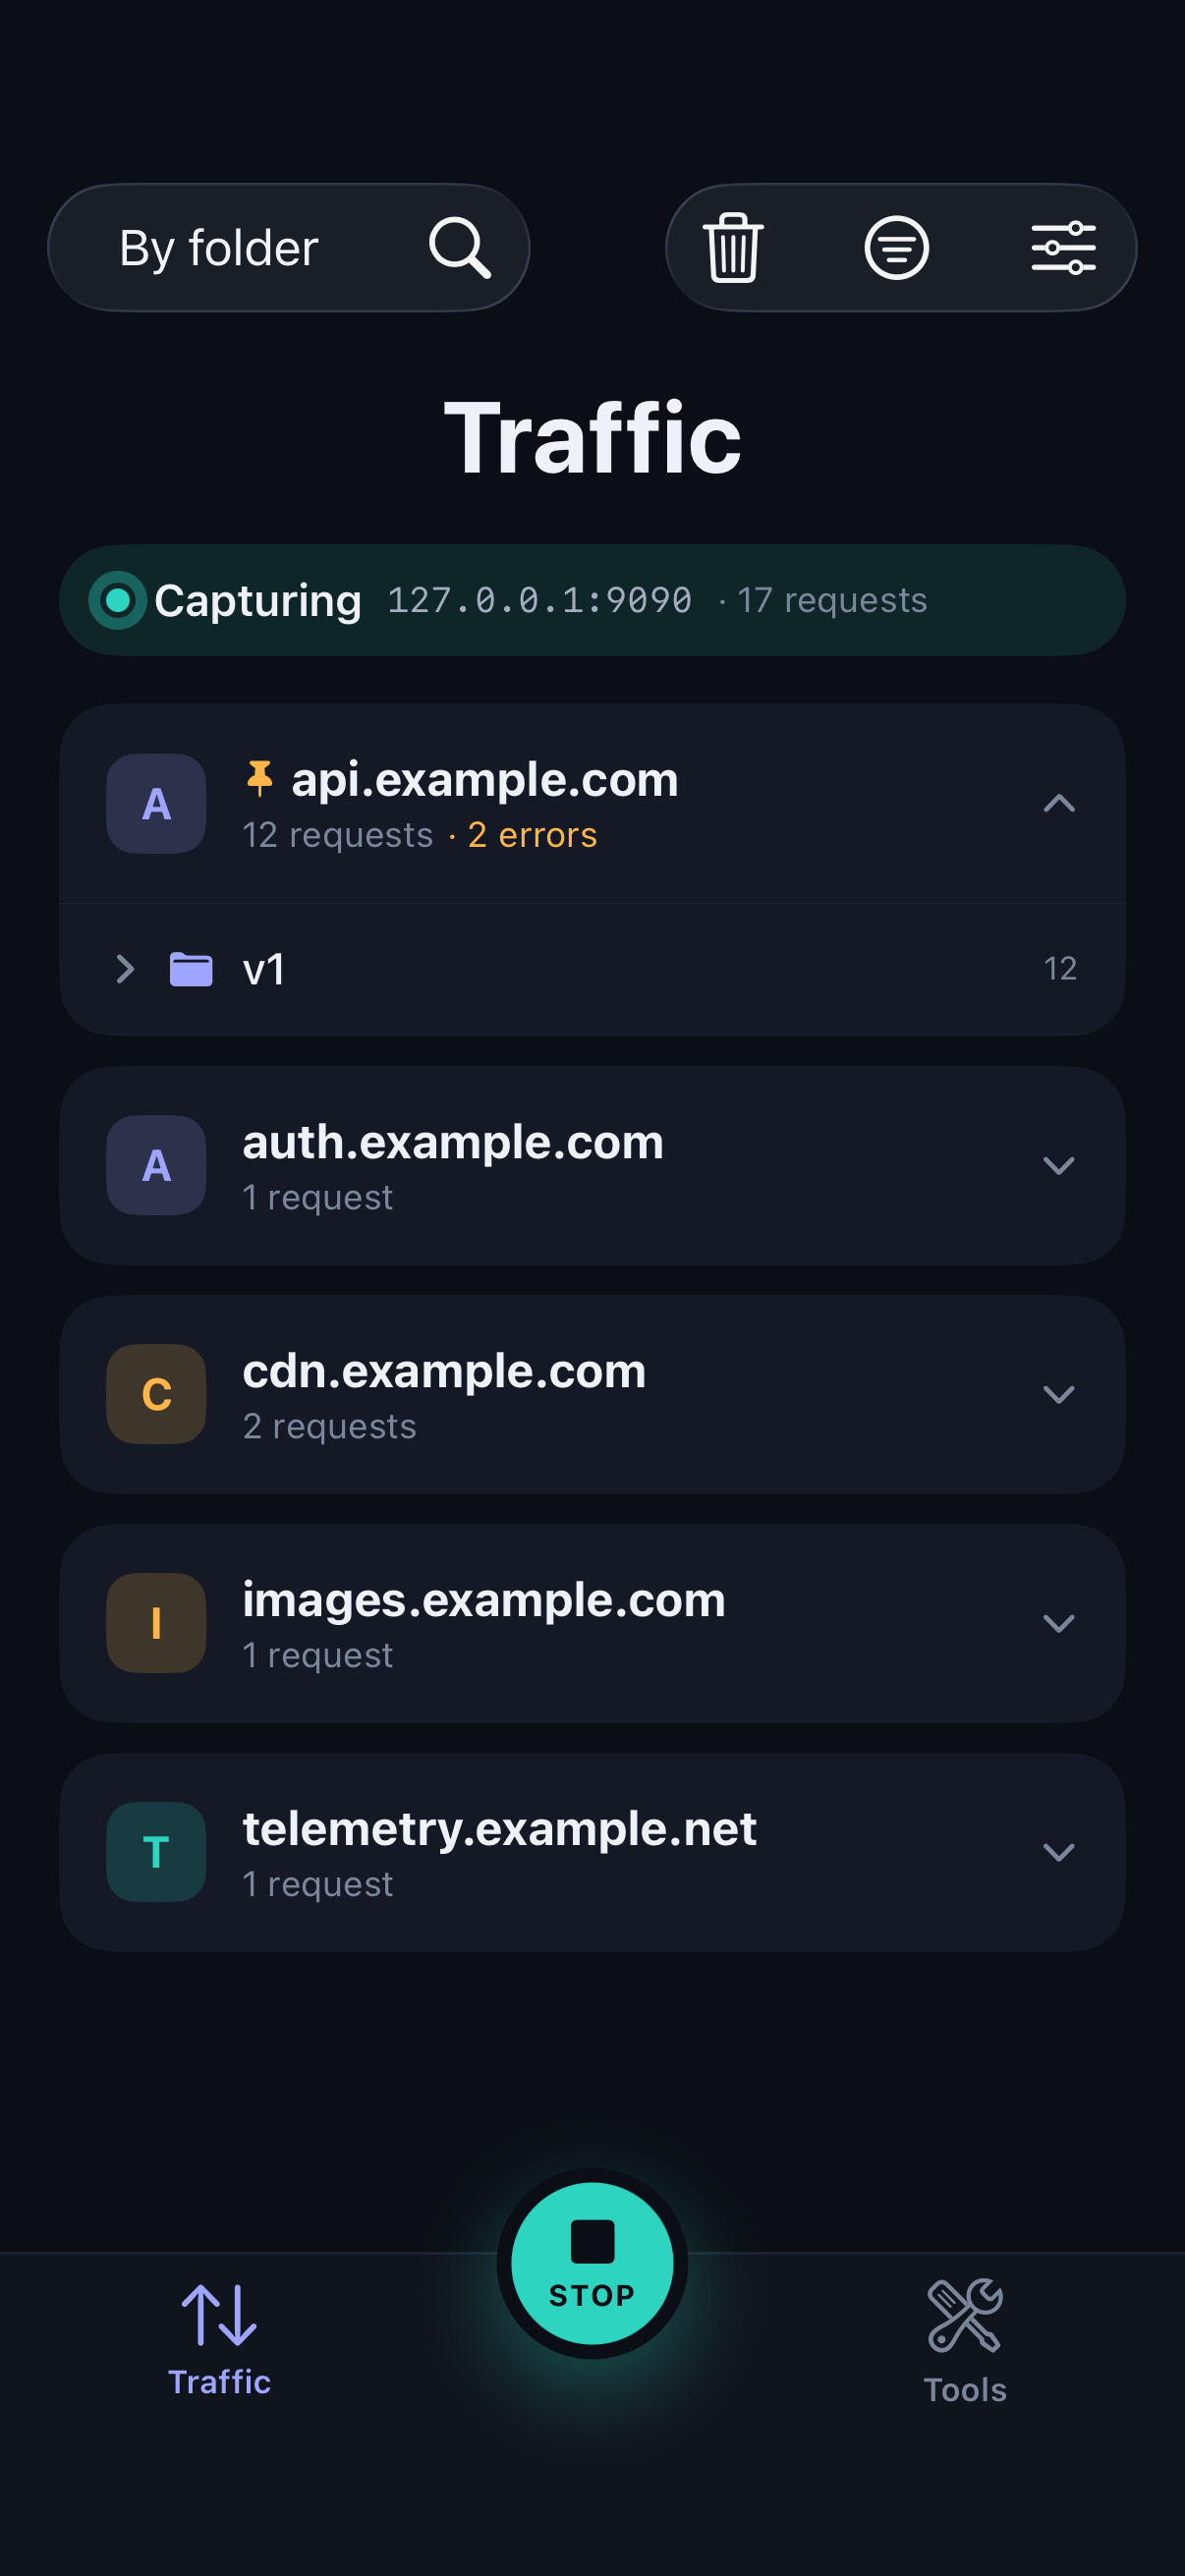
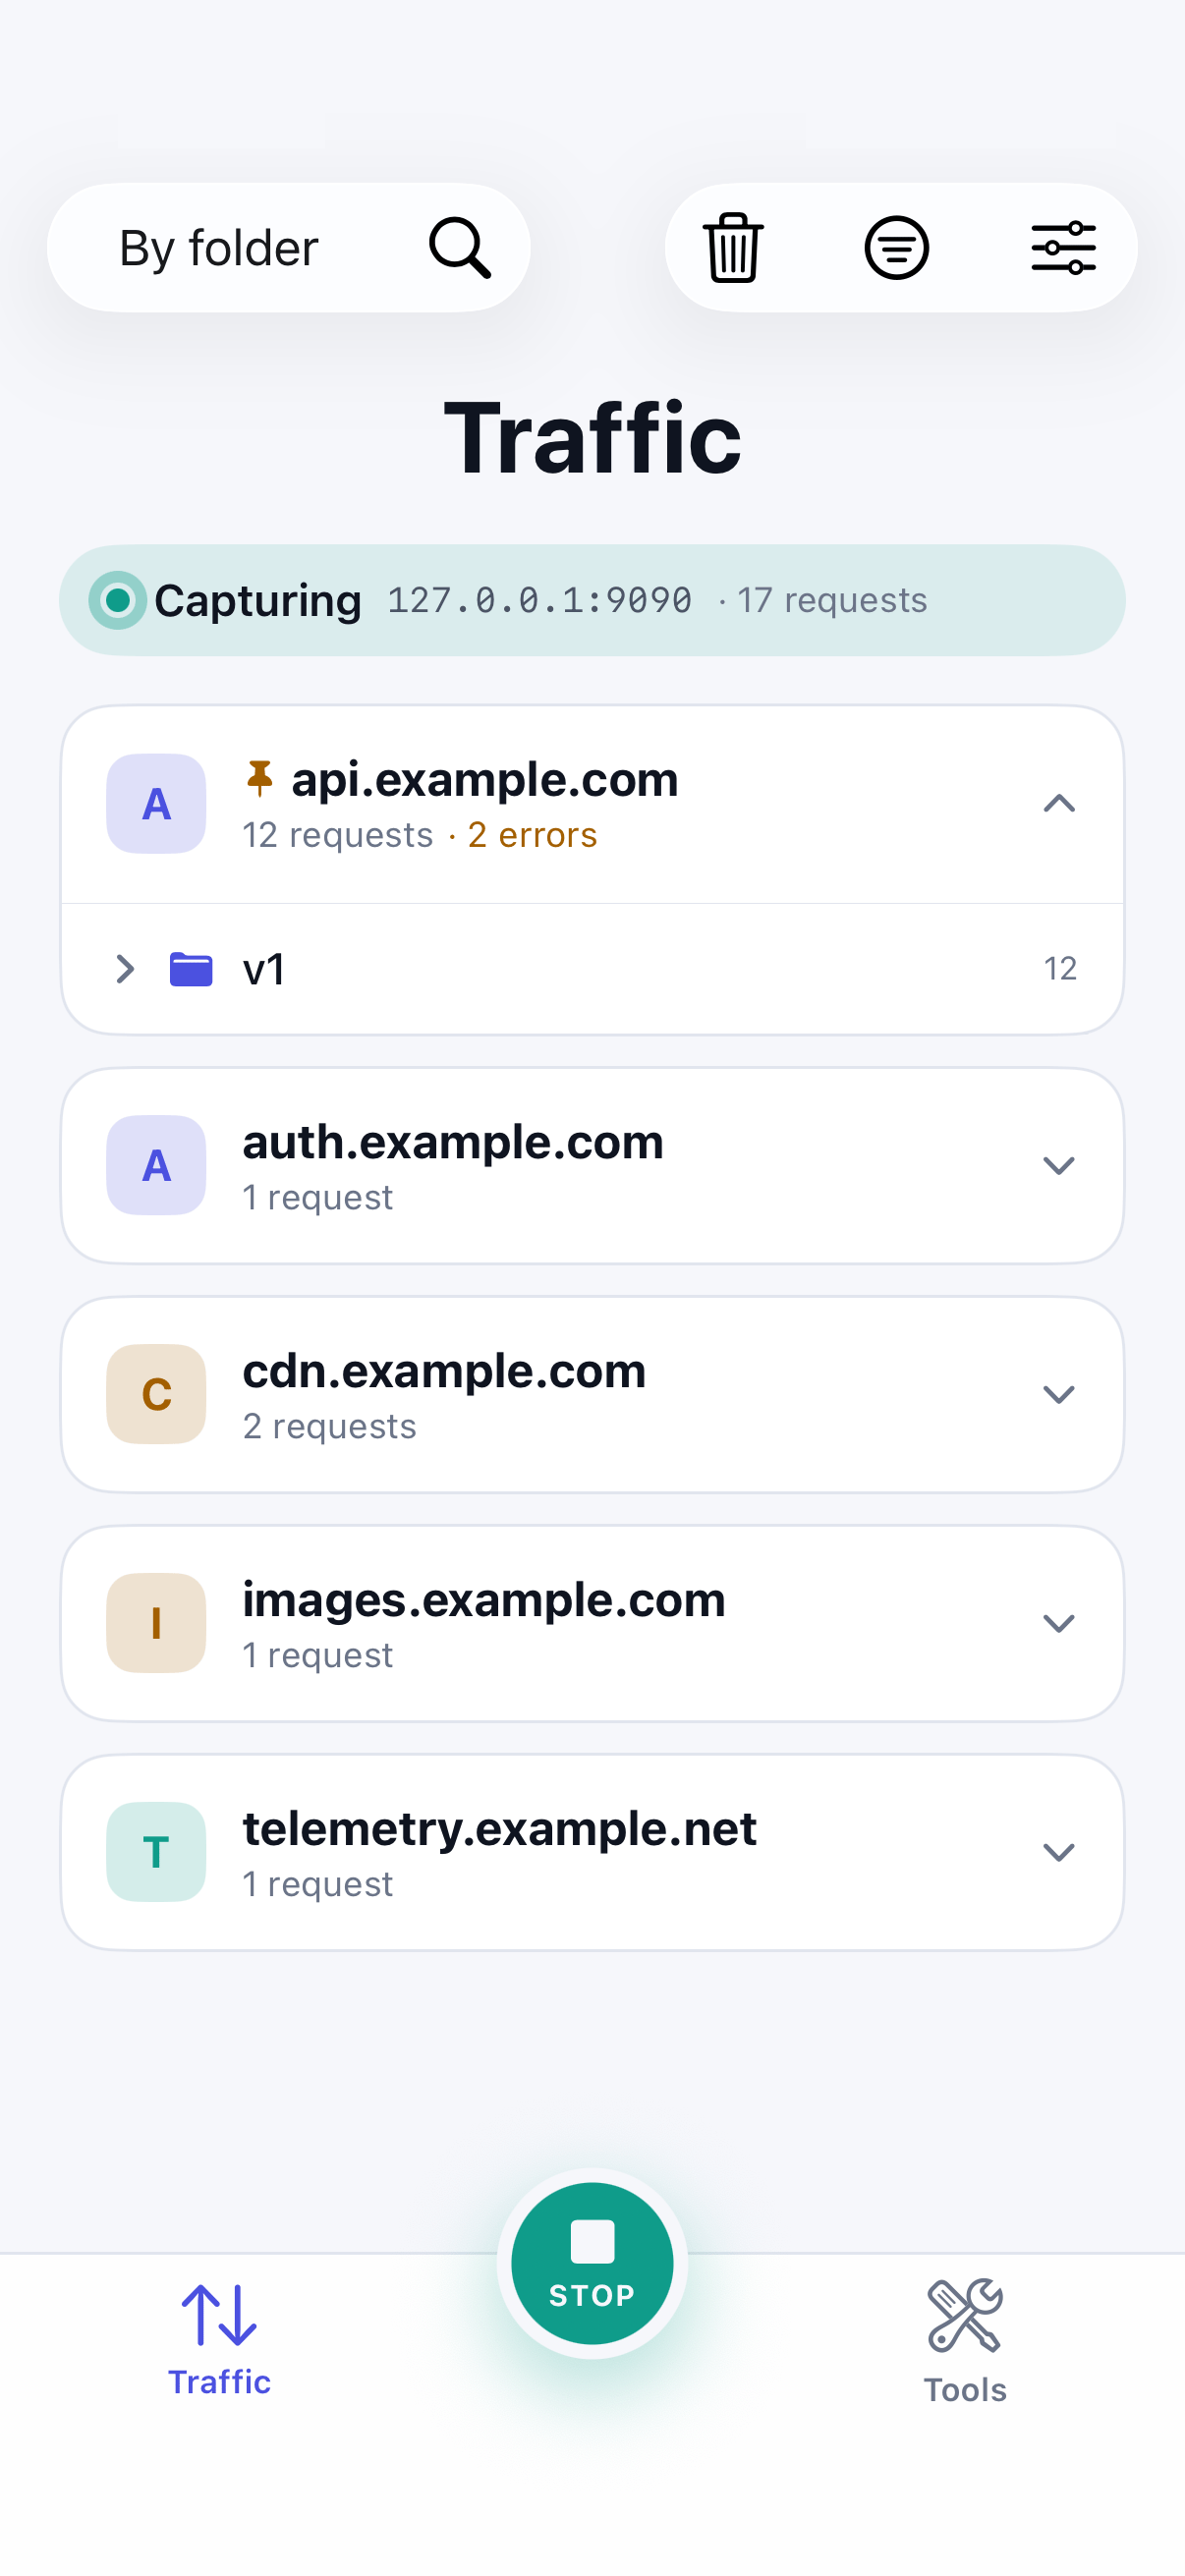
Group by folder
Choose By folder to see each host's requests arranged by URL path. This works well for large APIs with many endpoints.
Step 05
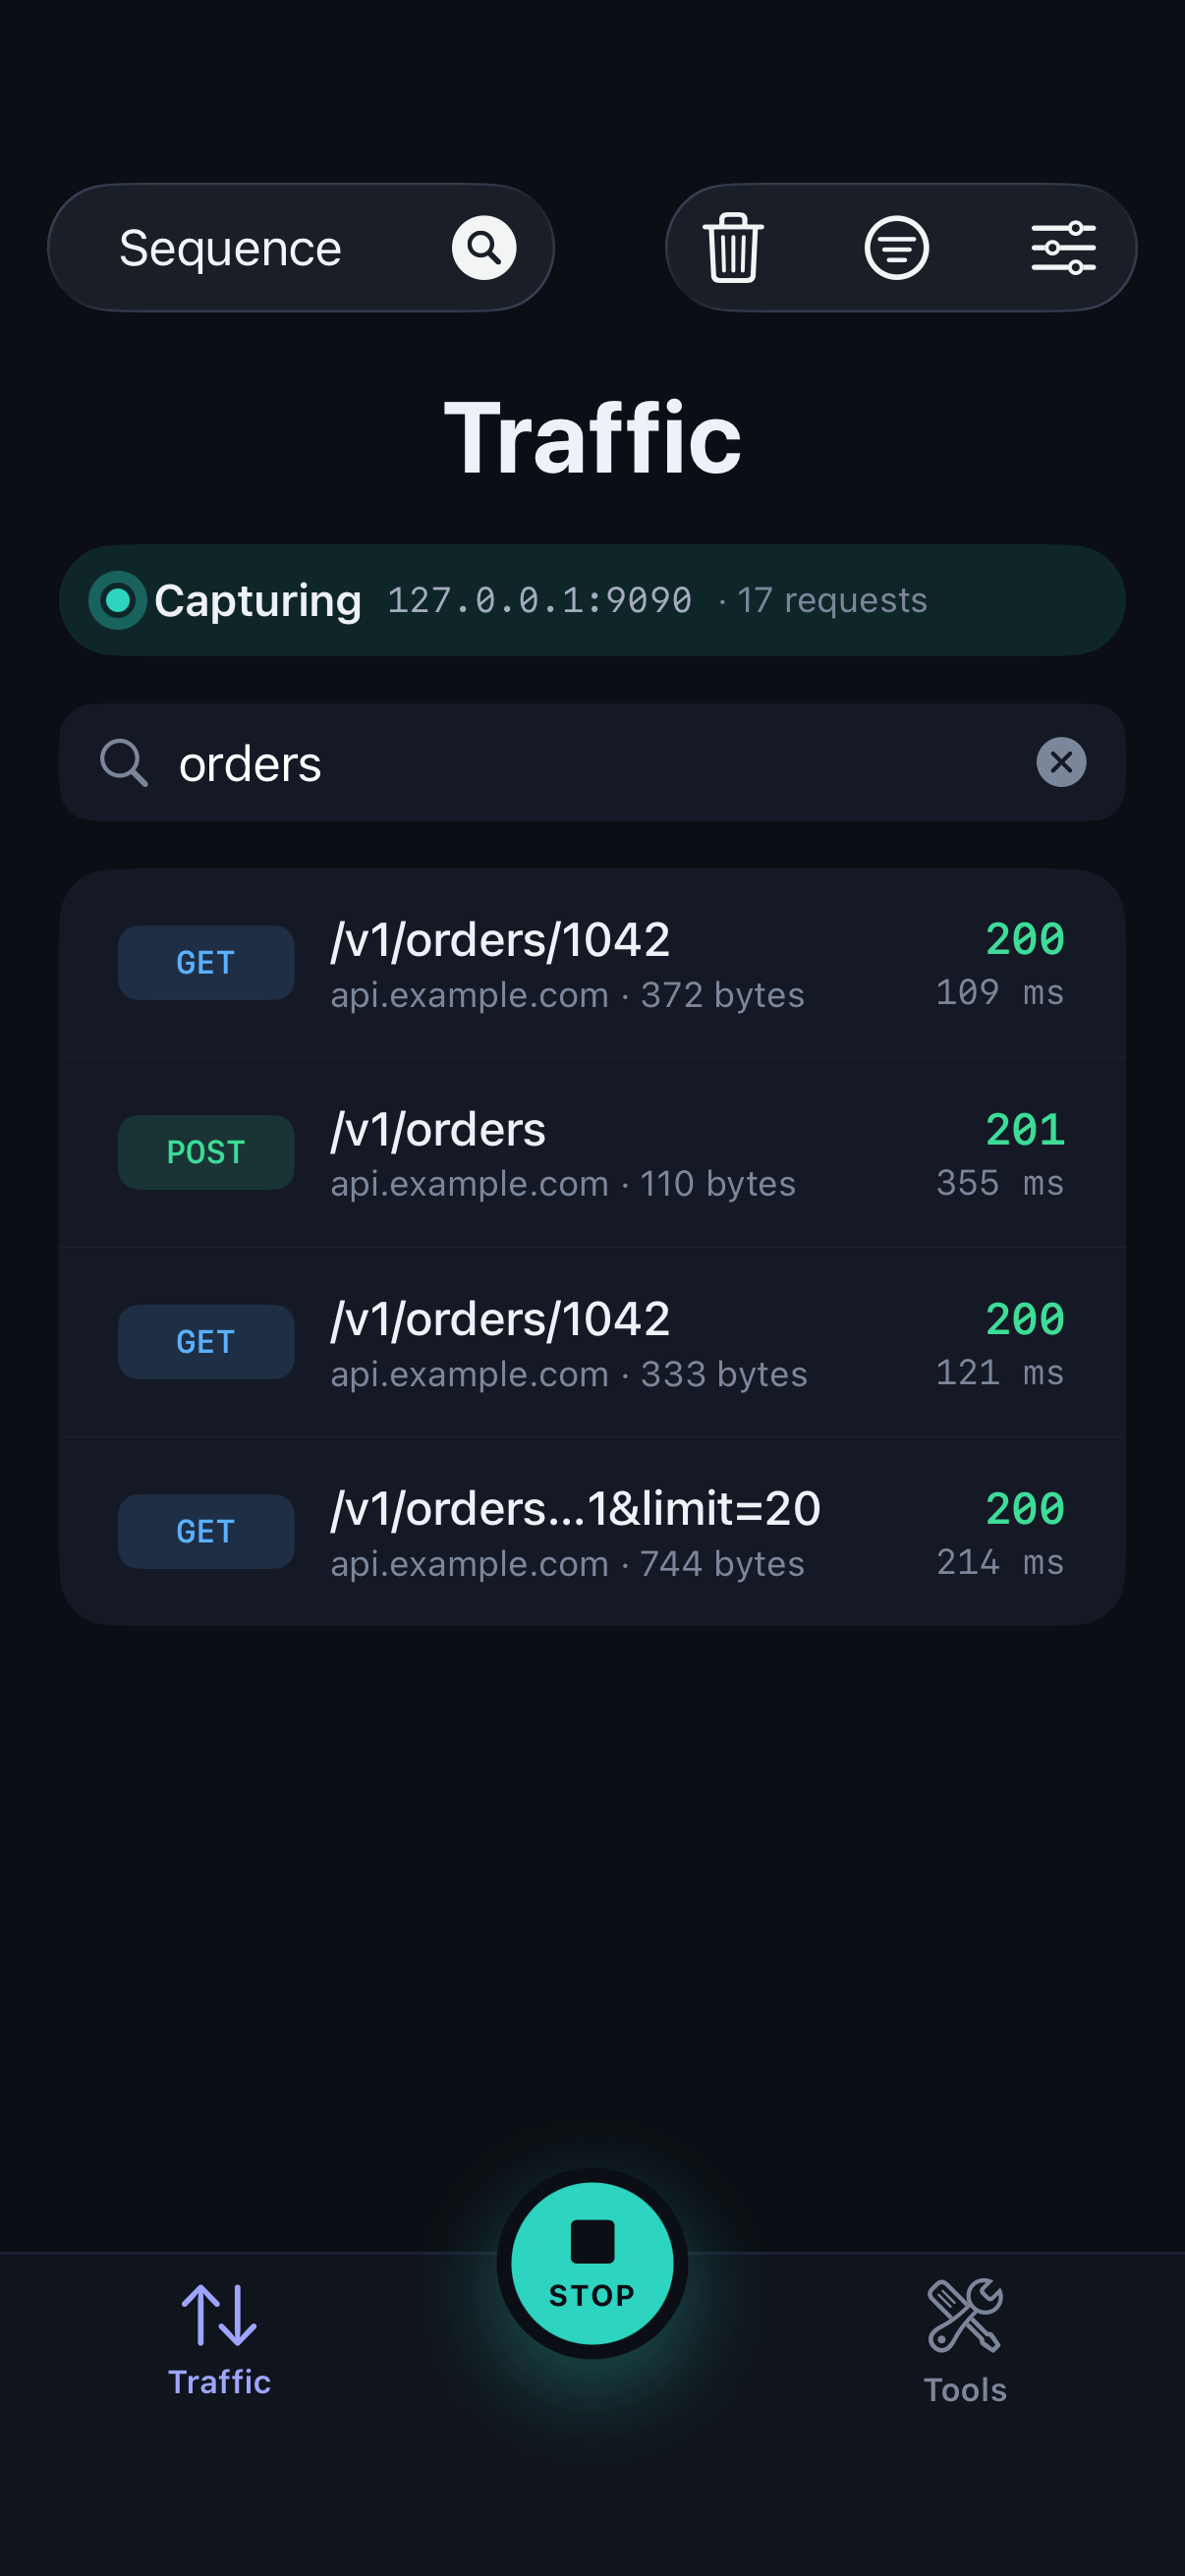
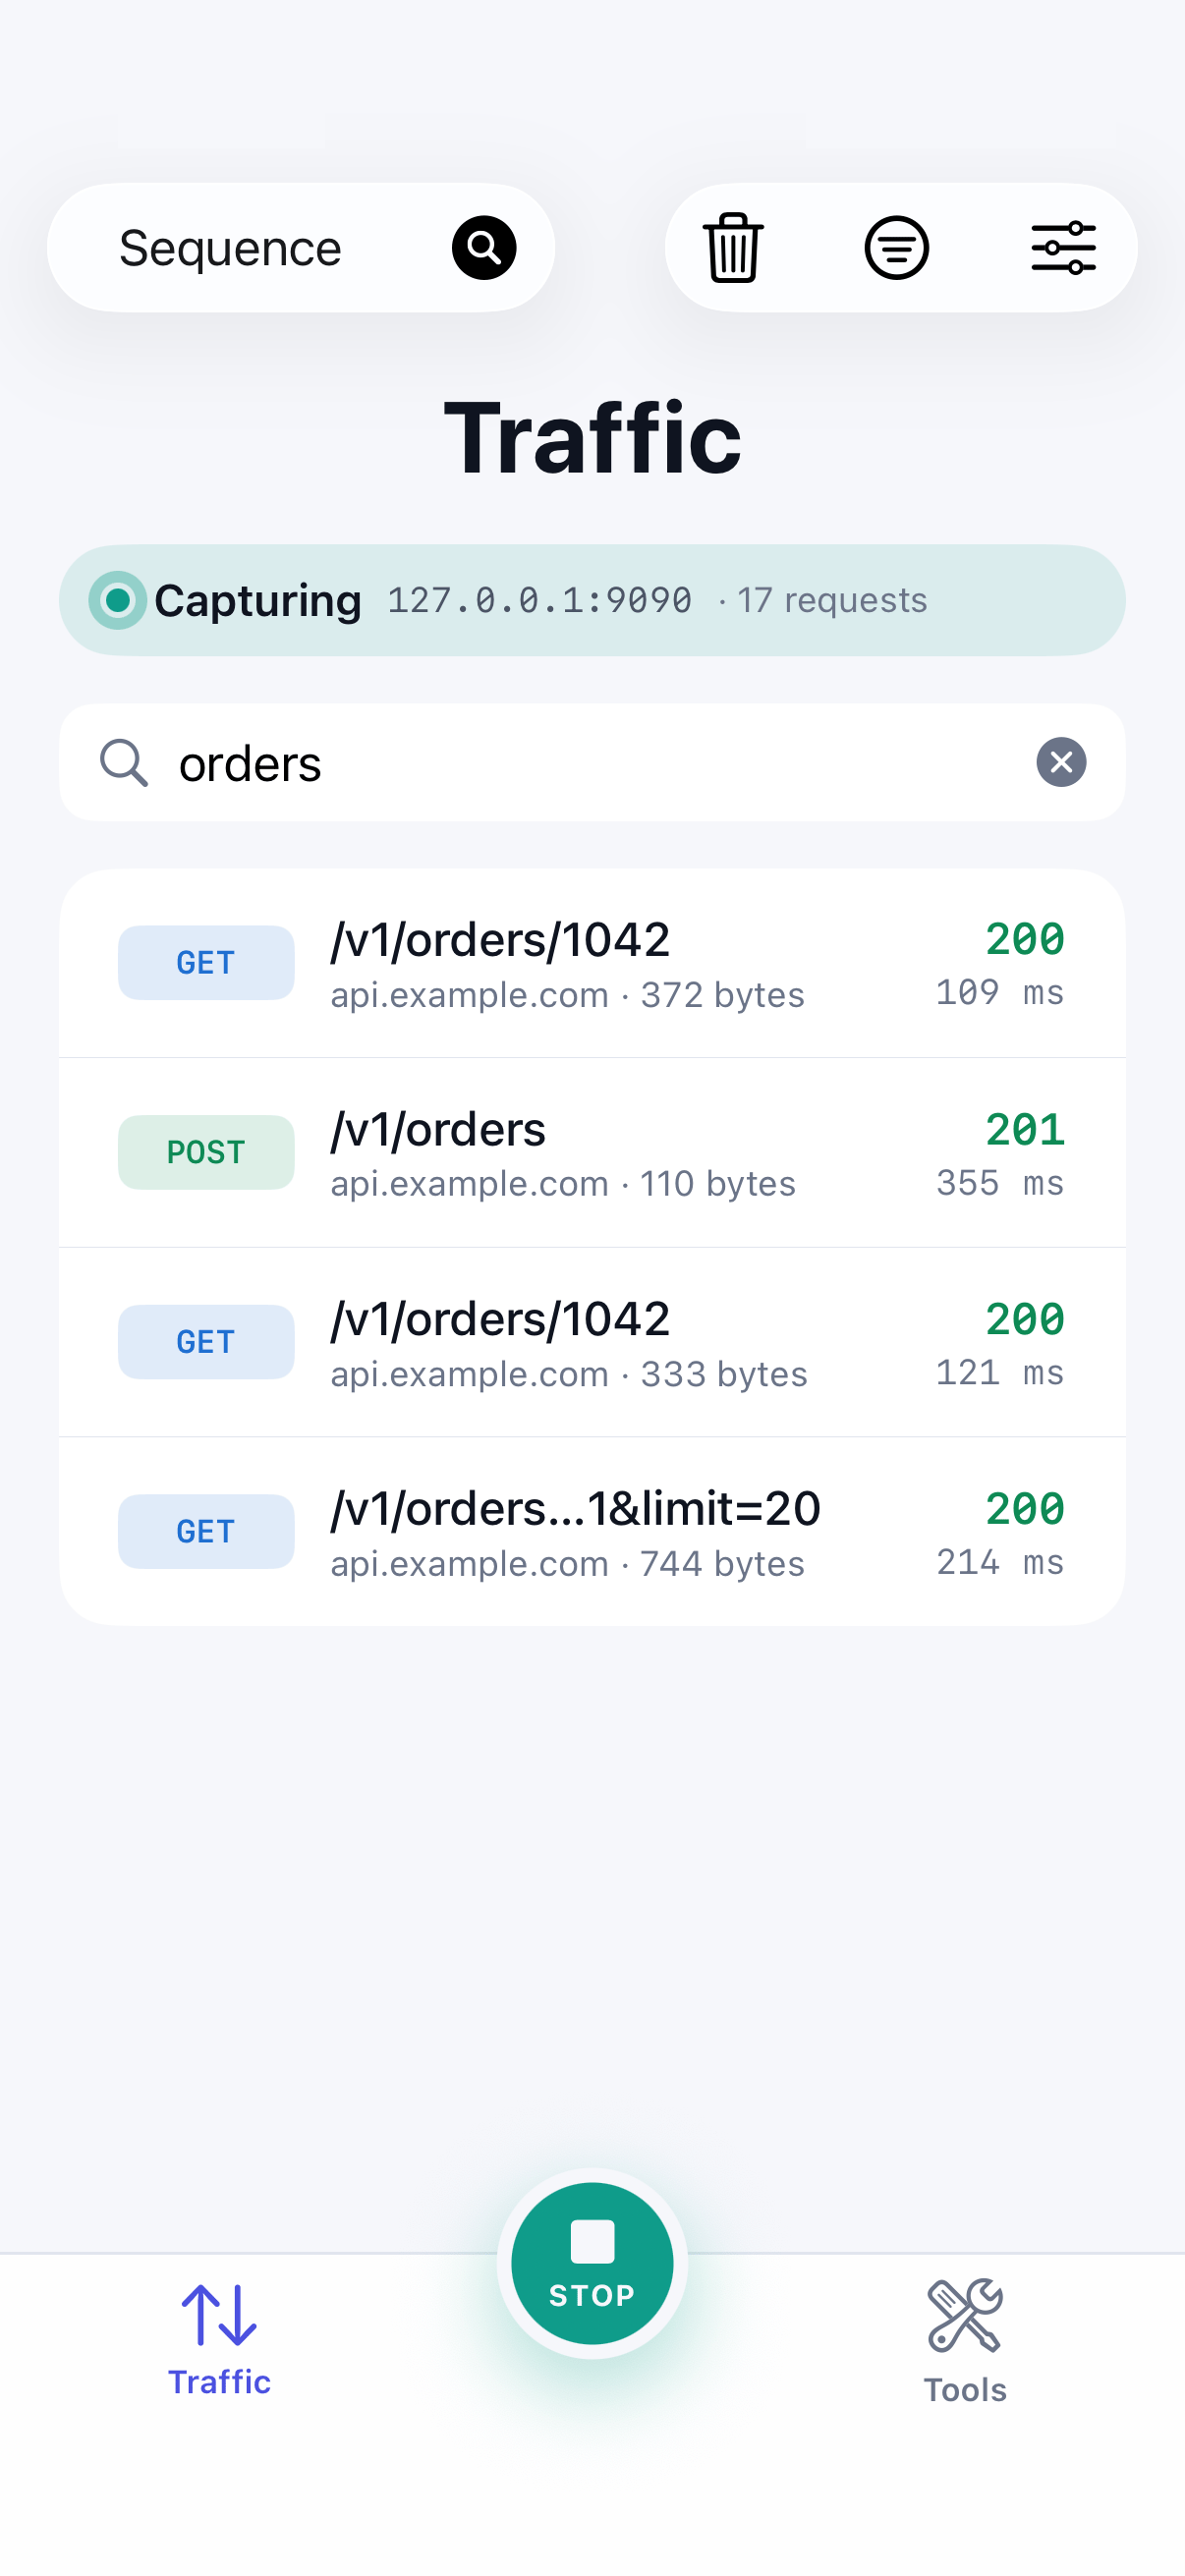
Search
Tap the search icon to search by host, path, method or status code.
Step 06
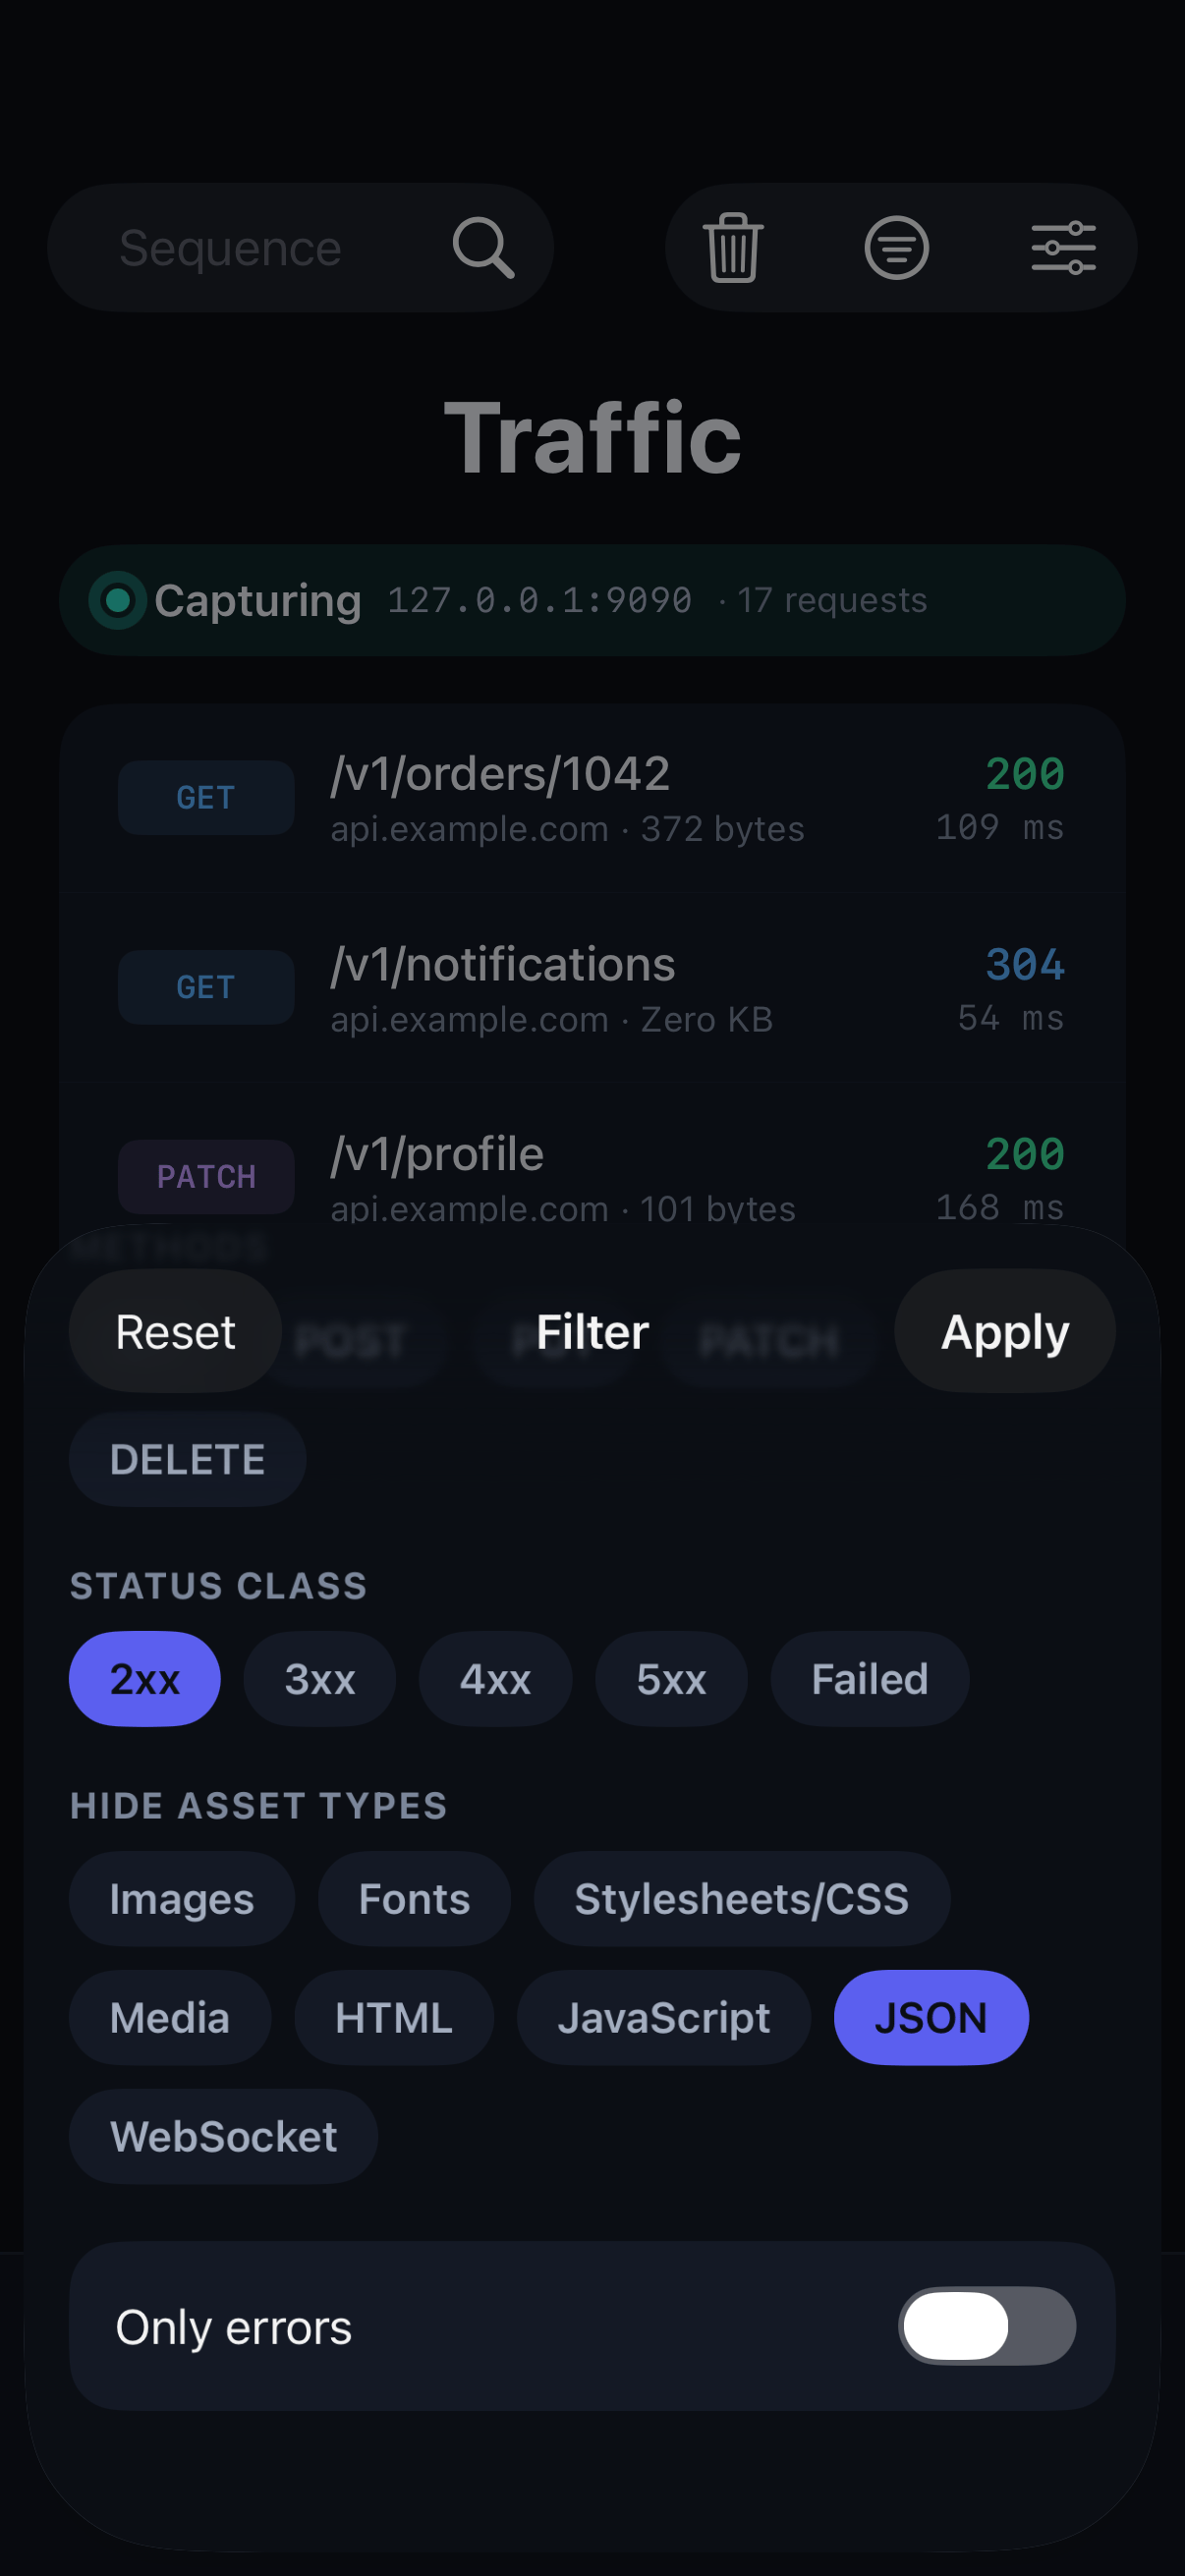
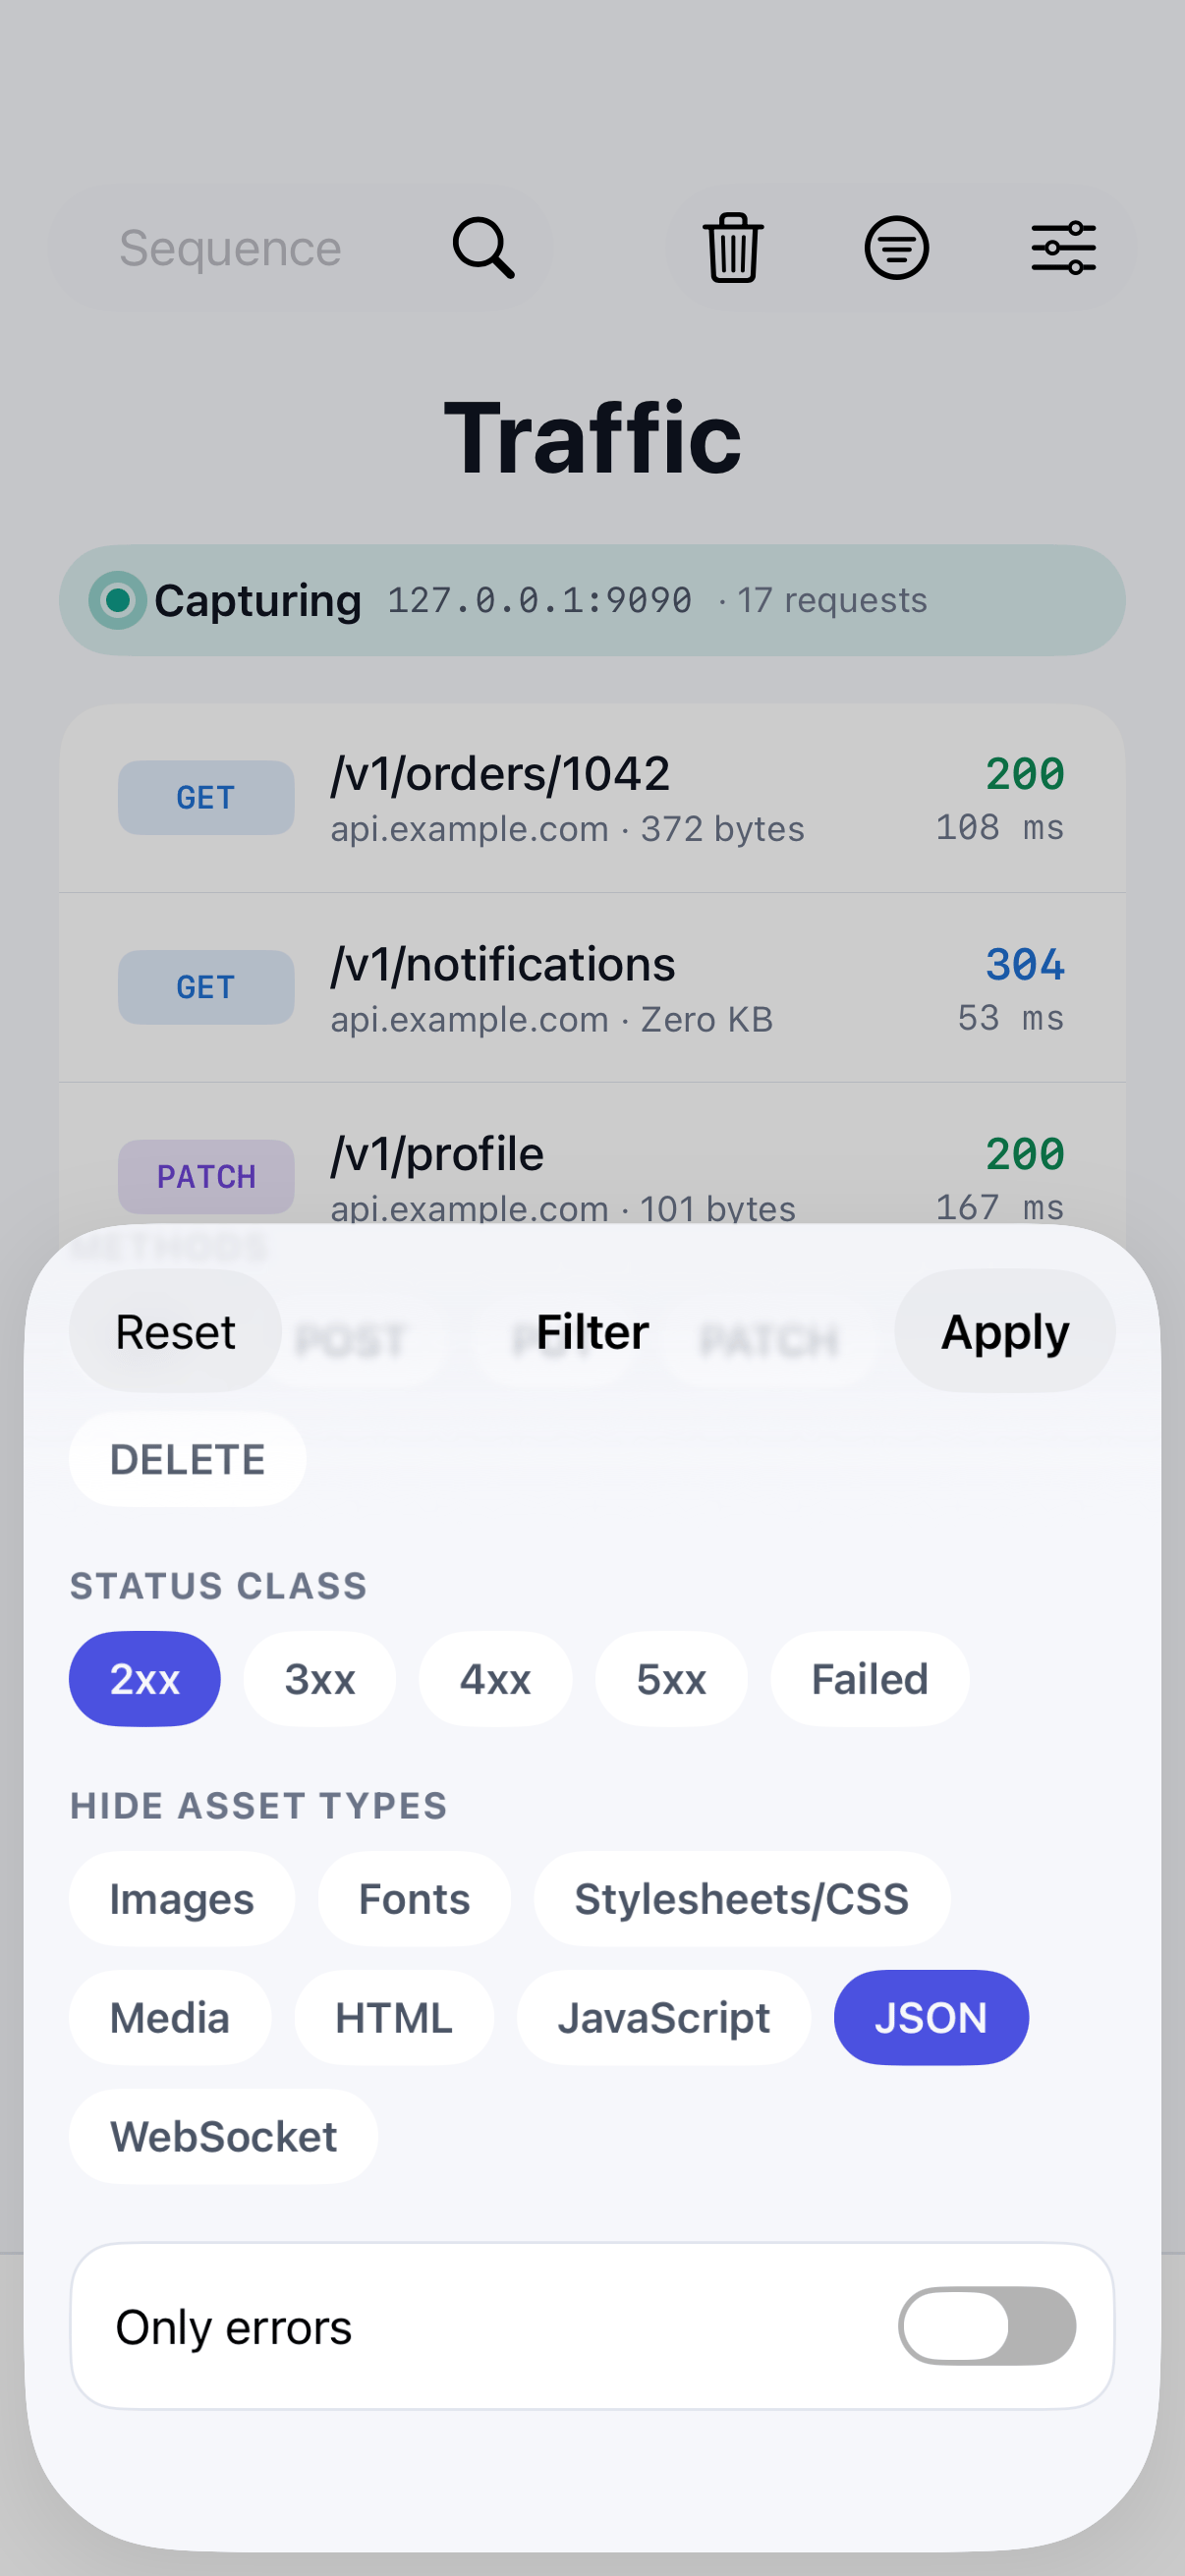
Filter
Tap the filter icon to narrow the list by method, status class or errors only. Hide asset types such as images and fonts to focus on API calls.
Step 07
Pin the hosts you check most
Touch and hold a domain card and choose Pin. Pinned hosts stay at the top of the list, even after you clear traffic.